After Two Years of Covid, Economic and Health Woes Persist in Diverse North Carolina Counties

by Ari Pinkus and Dante Chinni May 12, 2022 Print

The drive from Charlotte to Wadesboro, North Carolina, is not a long one. It’s a straight shot down U.S. Highway 74. But the road between the two cities — rolling by the Tesla dealership, past the strip malls full of fast-casual restaurants and into farmlands — tells a lot about how 50 miles can be the distance between different worlds.

On one end of the drive is Mecklenburg County, the most densely populated county in North Carolina, home to Bank of America and the NASCAR Hall of Fame. On the other is Anson County, where hogs outnumber people by a 2-to-1 margin.

In the last two years, everyone and every community in the United States have experienced the Covid-19 pandemic, but the ways they have experienced it and are positioned to emerge from it can look very different. And that’s true for places separated by just 50 miles of road, such as Mecklenburg and Anson counties.

Mecklenburg, a Big City in the American Communities Project’s typology, and Anson, a part of the African American South, show just how complicated the road out of Covid is. The pandemic presented different challenges and opportunities for both places that they are now just beginning to understand.

This winter, the ACP visited both counties to talk to leaders about how they and their neighbors have been weathering the pandemic and to understand what is next for them — economically, culturally, and socially. This report focuses on four factors in the two communities:

Economy and Opportunity
Housing and Development
The Pandemic's Impact on Health and Life
Voting Engagement

The hope is that by studying the differences in these two nearby communities, the ACP can shed some light on the nation’s complicated post-Covid landscape. (This piece is a companion to our newly released data report.)

Economy and Opportunity

Mecklenburg and Anson are a short drive from one another, but their economic structures, challenges, and opportunities are worlds apart.

Mecklenburg County

As a home to the biggest city in North Carolina, Mecklenburg County starts out with some advantages that provided economic insulation during the pandemic. When analysts talk about the knowledge economy of the 21st century, they have places such as Mecklenburg in mind. The county is a center for the banking industry and home to Bank of America, which offers the kinds of good-paying jobs that employees can do from home. The county is also home to the University of North Carolina at Charlotte, which has an enrollment of more than 30,000 and serves as a magnet for the young and educated.

The impacts of those different factors are evident in the Economic Innovation Group’s analysis of asset income at the county level (that’s income from dividends, interest, and collected rent). The per capita figure for Mecklenburg is more than $11,000. In nearby Anson County, the figure is about $4,600 per capita.

Those figures are enough to put Mecklenburg in the top 20% of counties nationally, while Anson sits in the bottom 10%.

The data before the pandemic and in January 2022 show that Mecklenburg has rebounded. The unemployment rate in January 2022 was very close to where it was two years previously. And, unlike much of the country, the community did not see a massive drop in its labor force. The figures for 2020 and 2022 are essentially unchanged.

But Charlotte is not without economic challenges coming out of Covid-19. Like many big, growing cities, its primary concern is creating an economic environment that works for its big, diverse population.

“I would say from an economic development perspective, one thing that we are challenged by here in Charlotte is this continuing evaluation of our upward mobility efforts falling short, you hear that all the time,” says Bobby Drakeford, founder of The Drakeford Company, specializing in residential development, urban housing, and land assembly brokerage. “The challenge I see there is so much economic prosperity and opportunity created by public investment that is not shared. … The resource rich are accessing public dollars more frequently than they used to, and there are not clear benefits to communities.”

Drakeford is talking about tax incentives that help builders and business owners expand and create jobs that tend to benefit the well-to-do in the county.

Mecklenburg sits just above the national the figure for economic inequity using the Gini Index — 0.486 versus 0.482 respectively.

There are, of course, some advantages in being surrounded by wealth. After all, the median household income in Mecklenburg, $72,300, is $5,000 above the national median. But as is the case with many Big City communities, spreading that money around is not easy. Mecklenburg is home to glass skyscrapers, upscale coffee shops, and expensive new condominiums, but that glittering downtown is a few blocks away from small single-story homes.

For all the bad of the pandemic, people working in the nonprofit sector in the county said it brought focus to long-standing inequities in the system — problems with good-paying jobs and affordable homes for those with degrees or jobs in banking, particularly the county’s African American community. The struggles of those with less were front and center, and the community rallied around the issues, at least for a time.

“It feels a little bit like our whole community was in a big room together. And there was a TV over in the corner playing this channel of what the needs are. And there was a blip where we had a big spike, but it's more like the volume just got turned up,” says AJ Calhoun, senior manager for data and evaluation at Leading on Opportunity, a nonprofit aimed at expanding opportunity in Mecklenburg. “But also people were like, this has been loud for a while, they kind of burned out on this. And so the mix of people that were watching the TV has changed a little bit. ... But fundamentally, I think we're back, kind of perhaps, where it was before.”

In sum, the community is emerging from the pandemic with a better of understanding of its needs. It still has the resources to try to address the challenges, but the pandemic’s eye-opening impact has faded.

Anson County

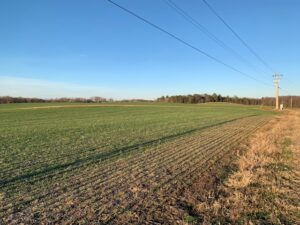
Anson County is different from its urban counterpart in most every way. The county is rooted manufacturing (advanced textiles and metal-working) and, to some extent, agriculture. Anson has not been attracting new residents. The county lost about 18% of its population between 2010 and 2020. And Anson’s median household income of $40,800 is only about 61% of the national median.

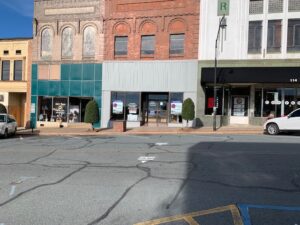
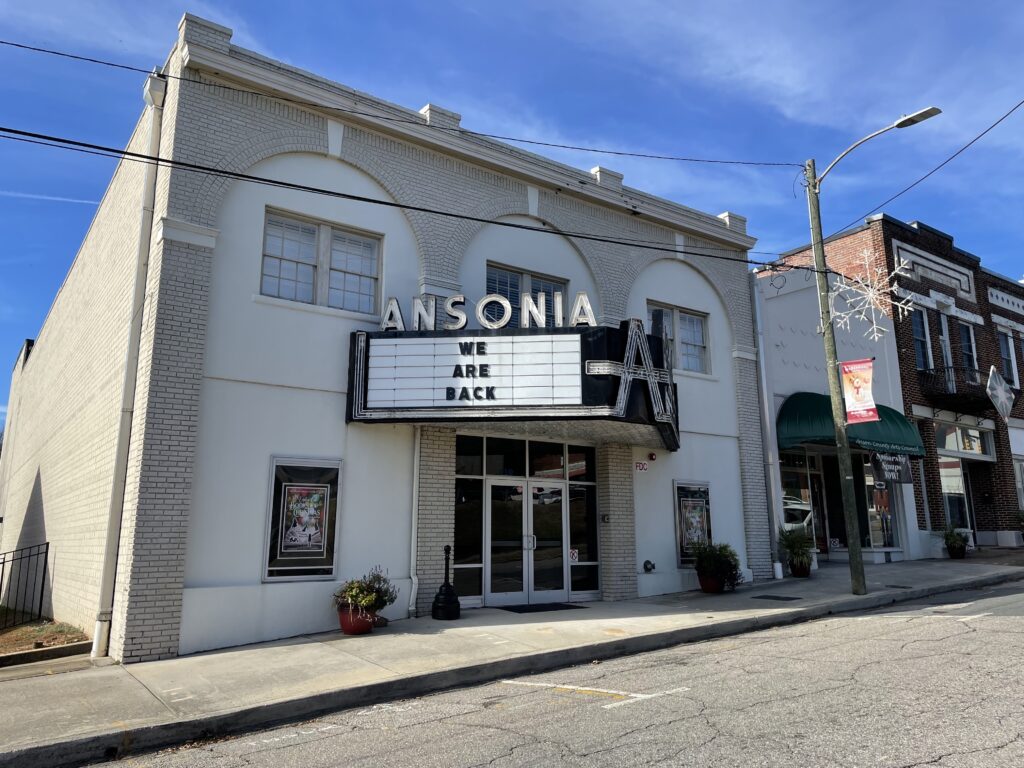
The roads here are marked by rural homes and poultry barns. A few small towns dot the landscape, including the county seat of Wadesboro, but drive through Anson and you will see a lot of open fields. While Mecklenburg is big and diverse, with good-sized Hispanic and Asian populations, Anson’s racial and ethnic diversity is primarily about white and Black residents — as is true for most communities in the African American South. Its 22,000 people are fairly evenly divided between African Americans and white, non-Hispanic residents. Only 11% of the population have a bachelor’s degree, and lower levels of education can be a challenge in the modern workplace.

John Marek, executive director of the Anson Economic Development Partnership, at Speckled Paw Coffee in downtown Wadesboro, North Carolina.

“The hard skills that [employers] are looking for are math and measurement skills,” says John Marek, executive director of the Anson Economic Development Partnership. “The textile industry, they work with these very, very large pieces of machinery that are either milling machines, or weaving machines. And there's actually a surprising amount of math involved in setting up and running those machines. And folks just don't have the math measurement skills, and a higher-level ability to read instructions and understand them.”

Of course, those were all factors in the county’s economic story before the pandemic. And, as noted above, the county’s asset income figures reinforce the larger narrative of a community that lacks resources in key areas as it tries to emerge from Covid.

The employment story in Anson pre- and post-Covid is also revealing. In January 2020 before the pandemic took hold, Anson’s unemployment rate was 4.4%. In January 2022, the figure moved to 5.1% — and increase of 0.7 percentage points — but that doesn’t tell the whole story. Because along with that increase in unemployment, there was a decrease in the county’s labor force. Comparing January 2022 to January 2020 shows a decline of about 6% in the number of people working or seeking a job.


When adding to the unemployment rate people who have left the workforce, the figure climbs into the double-digits. That’s not to say that all of those people who left the labor force want to work again. Some may still be concerned about Covid-19, and others may have reassessed their lives and opted out of returning to work. But the drop-off is sizable and will affect the post-Covid recovery in Anson.

The future for Anson, however, may be serving as the bedroom of the growing population of Charlotte and Mecklenburg as the sprawl from the area moves eastward and touches the edge of the county in towns such as Peachland.

“You can get from town hall in Peachland to the Bank of America building in uptown Charlotte in 45 minutes,” Marek says. “That’s why those developments are being built … you're getting the hope that they will attract people who are commuting to Monroe and Matthews or Charlotte. And don't mind a little bit of extra drive for, you know, to save $20,000 to $30,000 on the cost of the home.”

The bigger question is what that movement means for Anson in the coming months and years. If the county evolves into an extended Charlotte suburb, housing prices will rise and the economy will likely transition to be more service-sector driven. While that could lead to an increase in employment opportunities, service jobs tend to pay less than those in the manufacturing sector. As housing prices rise in Anson, it could create economic tensions in the county.

The long-term plan for Anson, coming out of the pandemic, may be an investment and push to get high schoolers to continue on to the local community college, which is free for residents.

Ansonia Theater
Ansonia Theatre in downtown Wadesboro, North Carolina.

Housing and Development

Mecklenburg County

Money from banks, private equity, corporations, and investors flows into Charlotte for real estate development projects, including luxury apartments and homes — it can seem like cranes and construction sites are ubiquitous fixtures here. At the same time, Charlotte’s basement economic mobility ranking among large cities hangs over this city, based on the 2014 study by Harvard Professor of Public Economics Raj Chetty and his team. Chetty's subsequent report in 2020 notes the continuing obstacles Charlotte residents face in achieving the American Dream, in part because of neighborhood inequities.

Indeed, the city's wealth divides are felt deeply in housing, a sector receiving renewed attention during the Covid-19 crisis. The Charlotte Housing Justice Coalition, a grassroots volunteer organization, describes the city's housing problems as part of the legacy of Jim Crow and neighborhood segregation, particularly in the explicit displacement of African American neighborhoods during the urban renewal of the 1960s and ’70s. People were dispersed to insecure housing, living in what little public housing was built, never having a chance to purchase a home.

Ismaail Qaiyim, principal attorney at the Queen City Community Law Firm, who works with the Charlotte Housing Justice Coalition. Photo courtesy of Ismaail Qaiyim.

Over the years, Charlotte, a finance hub and historically very friendly to business development, has extended its welcome beyond the old boys’ network to investors around the world, the Charlotte Housing Justice Coalition notes. “There’s a lot of talk of equity and these historic tragedies, but when it comes down to it, it’s just business as usual,” says Ismaail Qaiyim, principal attorney at the Queen City Community Law Firm, who works with the Charlotte Housing Justice Coalition.

Making affordable housing more accessible is an uphill climb. North Carolina does not allow inclusionary zoning or rent control. The local government could leverage more of its regulatory power, Qaiyim says, and the Charlotte Housing Justice Coalition has helped organize neighborhoods and communities to compel local government to use this authority. The group can point to success in the recently passed 2040 Comprehensive Plan after organizing several historically distressed African American neighborhoods. “Working hand in hand with the Community Benefits Coalition, which is supposed to be the Congress of Neighborhoods, … that’s really going to be the thing that makes the difference at the end of the day, because it’s going to be all of the neighborhoods [coming] together,” Qaiyim says.

As a result of organizing and advocacy with the Community Benefits Coalition, two sections were added to the 2040 Plan. The first formally recognizes the Charlotte Community Benefits Coalition as a stakeholder. The second is a policy directive to develop community benefits strategy along with the Community Benefits Coalition. The 2040 Plan now also includes an Anti-Displacement Implementation Strategy and establishes two City Council advisory committees: the Charlotte Neighborhood Equity and Stabilization Committee and the Equitable Development Committee.

Mecklenburg County did take steps to handle immediate shelter needs when Covid-19 first hit the community in March 2020, according to WCNC Charlotte. As the outlet reported, Mecklenburg leased a hotel with 123 rooms for homeless people who tested positive or were suspected to have Covid, drawing on $300,000 in funds primarily from the Federal Emergency Management Agency to pay for the rooms, including security, rent, staffing, and cleaning. The county discontinued payment on December 31, 2021, when the funding ended. County leaders continued working to ensure shelters maintained quarantine protocols for positive cases. Another county program that funded hotel rooms for Tent City residents ended in September 2021.

In December 2021, the average rent in Charlotte was $1,472 for 942 square feet, according to Fox 46's analysis from RentCafe, with renters making up 41% of city households. Rents climbed more than 16% from 2020 to 2021. The biggest housing deficit is for residents who are at or below 30% area median income; more than 20,000 units are needed, according to the UNC Charlotte Urban Institute.

The housing problem is not abating. In early 2022, Bobby Drakeford said he’s involved in more deals than ever. He notes that 98% of the community’s affordable housing fund goes to rental properties, “which is not good economics for folks, since instead of building wealth and homeownership, they are tenants. The reason that happens is that it’s more expedient, I think, to talk about units delivered, as opposed to the impact of the units delivered. So, the rentals get you volume, but the substance is not what we need for economic mobility…. It’s easier to fund a rental developer than to help a bunch of homeowners.”

The Charlotte Mecklenburg Black Political Caucus, composed of more than 200 members in Mecklenburg County, has been trying to move the needle on this issue and recommended that 30% of the $50 million Housing Trust Fund allocation be devoted to homeownership initiatives.

Bobby Drakeford, founder of The Drakeford Company, specializing in residential development, urban housing, and land assembly brokerage. Photo courtesy of Bobby Drakeford.

Drakeford, a lifelong Charlotte resident, highlights the mindset challenges here. “I am not an affordable housing developer. I don’t do many public projects, but when I do, I always think about, you know, how equitable is it? And that’s just not how we are thinking here in every instance.”

But equity has different facets, he points out. “Real estate development in historically African American communities is a function of entrepreneurial capital…there are two sides to that equation. One is, you know, white folks are willing to invest but also Black folks have to invest. There is Black wealth in Charlotte. I don’t think much is coming into our communities. I live in the community I grew up in, not a particularly distressed community, but not a particularly affluent community either… I don’t think many of our corporate executives are investing in Black areas.”

In some ways, Drakeford’s background underscores how one’s childhood neighborhood makes a difference in one’s life path. His well-established neighborhood Northwood Estates was the only Black neighborhood in Charlotte’s history that had tennis courts and a swimming pool when he was growing up, although it’s experienced some decline more recently, he says. “A lot of folks I grew up with are involved in leadership positions in the city. And, of course, even growing up we had a lot of business owners in the community and professors and principals and doctors and lawyers as well. That’s not the case today. But most people I grew up with live fairly prosperous lives.”

Today, the housing gap continues to grow. Charlotte has been named among America’s 10 most overvalued cities, as homebuyers pay a 50% premium, according to a 2022 study by researchers at Florida Atlantic University and Florida International University.

Anson County

From left to right, Carol Holloway, board member and community volunteer; Chipper Long, executive director of Anson County Homes of Hope; and Susan Hallman, president of the board of directors in Wadesboro, North Carolina.

The problem of available and affordable housing isn’t confined to Big City’s Mecklenburg County. About 50 miles away from Charlotte in the African American South, Anson County Homes of Hope, based in the county seat of Wadesboro, provides housing to those in need through bridge, affordable, emergency, and rapid rehousing. The nonprofit’s mission is more urgent than ever. Says Executive Director Chipper Long, “The inventory is completely taken up. You can't really find a place to buy or to rent. We have just come out of the moratorium … people [who] did not pay their rent, they’re being evicted. And I’m getting sometimes five to six calls a day from people looking for shelter.”

You’ll find people sleeping anywhere they can find a space, Long says, in cars, in sheds, in abandoned buildings, under houses, under bridges, in the cemetery, and couch surfing.

To meet the great need, the nonprofit looks to take over property in low-risk areas, repurposing homes into apartments, like taking a three-story home on Park Road and turning it into three three-bedroom apartments beginning last June. The idea is for everyone to have their own space. In 2019, the nonprofit bought a duplex and renovated it, enabling two families to live there now.

Long eyes more projects. He’d like to be able to use public and private funds to renovate Anson County’s old textile mills for new housing. For example, he says, building a place for seniors of limited income could welcome those now forced to leave the county because they cannot afford the more expensive facilities available.

In recent years, Charlotte money has been flowing into Anson, skewing the housing landscape. Outside investors are buying and holding homes or fixing them up for rentals. “Anson County has become really hot because you can get more bang for your buck. The house that I live in would be over $1 million in Charlotte. And so, you’ve got land, you’ve got walkability, you’ve got community. That’s why they’re coming in,” Long says.

The Pandemic’s Impact on Health and Life

Very different populations, socioeconomic conditions, and densities have made for different pandemic experiences in the two counties.

Mecklenburg County

When the Covid pandemic hit in 2020, Mecklenburg had a few points working against it. Like other Big City counties, it is densely populated and, while it holds wealth and high incomes, it also holds neighborhoods with high poverty rates and poor housing stock. The county seemed like it was designed for easy spread of the virus — and holds populations likely to be vulnerable. But the case numbers largely followed the national trend. In fact, nearby Anson County had slightly higher overall case rates during the pandemic through late April 2022.

Nationally, the overall figure was about 24,500 per 100,000 people. In Mecklenburg, the figure was roughly 25,303 per 100,000 people. In Anson, the figure was about 26,700 per 100,000. Mecklenburg also had a lower Covid death rate than Anson, about 0.13% of its total population compared to 0.43% in Anson.

When people did get sick in Mecklenburg, hospital beds were available to care for them. The county has 2.2 hospital beds for every 1,000 people and 0.15 Intensive Care Unit beds for every 1,000 population. In Anson County, those figures are 0.6 beds for every 1,000 people and 0 ICU beds.

Hospital workers were stretched thin and pushed to the limit in Mecklenburg, of course, as they were everywhere, but residents had care in their community.

On the other end of the economic spectrum, Mecklenburg, with its high number of office and banking jobs, was in a better position to have a large portion of its population work from home. About 45% of Mecklenburg’s employees work in management, business, science, and arts occupations. That compares with about 39% nationally and about 25% in Anson County.

As a result, the skyscrapers that dominate the county’s skyline in Charlotte may have been dark for a time — Bank of America had 16,000 employees working from home during the worst of the pandemic — but the employees were still working in home offices and on kitchen tables.

Ultimately, the contours of Mecklenburg’s economy and the resources it had to apply to the pandemic may have shielded it from the worst of Covid-19’s impacts. The pandemic also brought attention to some of the community’s deeper challenges, however. The open question is whether the community uses this opportunity to address them.

AJ Calhoun and Virginia Covill of Leading on Opportunity based in Charlotte, North Carolina.

Says Virginia Covill, deputy director of strategy and operations at Leading on Opportunity: “I think the hope is that in some ways, it feels like we're rebuilding a little bit, piece by piece, some of these things, and the layers are coming back on as things get busier. And so I think that is the hope as we look at everything from as simple as, ‘do I need to go into the office?’ … And I think that then translates to community work, too … ‘Are we putting all of the pieces back together in the right way?’”

Anson County

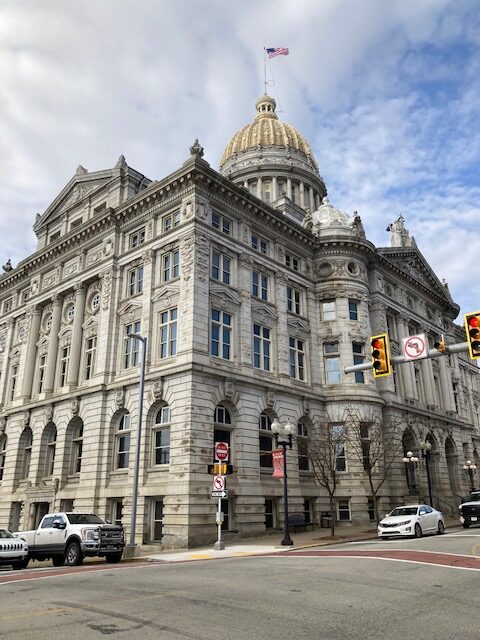
In the small, tight-knit community of Anson, the effects of Covid were felt more directly, changing the way friends and neighbors interacted. When you live a smaller community, the opportunities for interaction are often fewer and the loss of them can hit harder. Marek noted that Anson had an outbreak in its government center in late 2020 and virtually the entire government was infected; a couple of important people died.

There are a number of reasons why Anson had a harder experience with Covid than Mecklenburg. Its population is older and older people were more susceptible to the virus — more than 19% of the county’s population was 65 or older, versus 11.5% in Mecklenburg. And a far smaller share of Anson’s population has bachelor’s degrees compared to Mecklenburg, 11% versus 46%, respectively. That likely had an impact on how many people got vaccinated. Survey data show that those without college degrees were far more skeptical of the Covid vaccine than those with degrees. That’s reflected in the vaccine data in the two counties.


By the end of April, only 47% of the population in Anson had received two shots of the vaccine. In Mecklenburg, the figure was 64% — a 17-point difference. Survey data also showed African Americans were less likely to get vaccinated and roughly half of the population in Anson is Black versus about 33% in Mecklenburg.

But beyond the numbers, the biggest Covid impacts in Anson were more personal and struck at the fabric of the community, particularly around faith, says Rev. Alban Burney, pastor of the Ebenezer Missionary Baptist Church, in Wadesboro.

“If there was a problem before Covid, Covid has exacerbated the problem. If attendance at church was spotty before Covid, Covid has now given people a reason to say hey, right, I don't think I'm coming back," Burney says. So that is what I'm dealing with, with my congregation, there's a little bit of depression, grief, about trying to get back to, to the way things once were.”

Religion matters more in Anson and African American South communities like it, compared with Mecklenburg and other Big Cities. Only 12% of the population in Anson is religiously unaffiliated, according to the 2020 Census of American Religion from the Public Religion Research Institute. In Mecklenburg, the figure is 24%. Those county figures largely match the numbers for their community types.

Burney says that during the worst parts of the pandemic, local ministers were torn over whether to open for services, particularly funeral services. They knew the gatherings would probably aid the community spiritually and culturally, but everyone understood the risks. At his church, as Covid waned, he still conducted Facebook Live services along with scaled down in-person services that had light attendance. It was necessary, he says, and the long-term impacts will be felt for a long time.

“Going to church was just part of their routine. On Sundays, it was a way to get out, it was a way to see people. If you've been around older folks, for a significant amount of time, you know that they are very set in their ways. And when something disrupts that it's tough. It is tough,” he said. “And so my role is to try to help them with that grief. But I also have to help them understand that church is not going to be what it once was; there are some people who will not be back,” Burney says.

In the audio clip below, Rev. Alban Burney describes the slow evolution of race relations and his own experiences in Anson County. 

Voting Engagement

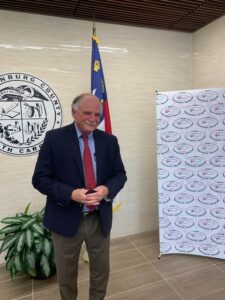
Covid-19 and unrest may have cast a long shadow over the 2020 election season, but North Carolina voters made their voices heard at the ballot box. Election officials in Anson and Mecklenburg counties ensured public health protocols were put in place to make things run safely and smoothly. Sherry Melton, Anson County’s interim director of elections, recalled masks being offered to anyone who needed one. Mecklenburg County Elections Director Michael Dickerson described giving voters a personal pen/stylus, so no one had to touch a screen; putting up sneeze guards; and providing staff with personal protective equipment. Community involvement was tremendous as Dickerson and his team scouted the county and grabbed up 33 early-voting sites, he said. The Charlotte Hornets and Carolina Panthers offered their stadiums free of charge — and gave voters free parking.

Anson BOE
Anson County's Interim Director of Elections Sherry Melton in Wadesboro, North Carolina.

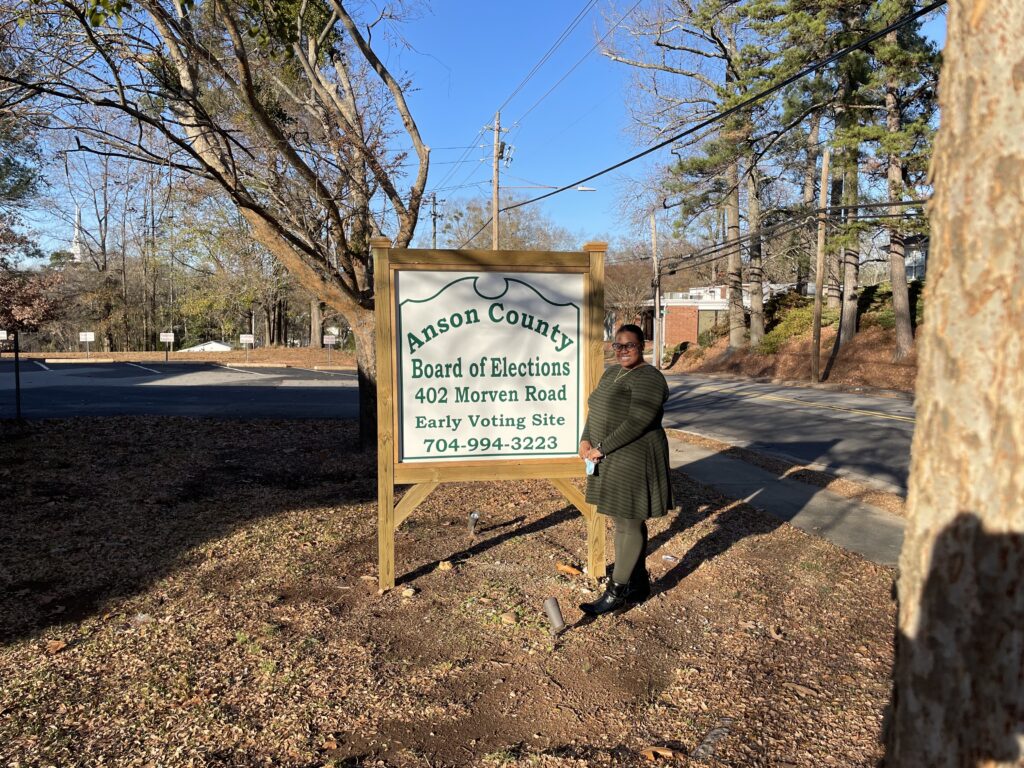
North Carolina has made voting easier in various ways, and many residents availed themselves of these means in 2020, according to interviews with elections officials in both counties. Melton remembers high traffic in the parking lot during early voting.

The Tar Heel State has a lot of experience with early voting, having adopted it in 2000. Its one-stop early voting law allows would-be voters to register and vote on the same day. They can choose to vote in-person or cast an absentee ballot in person during the two-and-a-half-week window. Or voters can vote absentee by mail. Once Election Day rolls around, registered voters must vote at their assigned polling place.

The state was one of just five with presidential, gubernatorial, and senatorial contests on the 2020 ballot. As in so many American communities, the 2020 presidential election was widely watched and fraught in these parts. Polling staff in Anson and Mecklenburg showed conscientiousness amid the scrutiny and increased interest, Dickerson and Melton said.

  • In Anson County, overall voter turnout was 67% or 11,277 voters, and 63% cast ballots through one-stop early voting, while 7% mailed them absentee.
  • In Mecklenburg County, the voter turnout was 72%. Of the 569,287 people who cast ballots, 65% chose one-stop early voting, and 24% opted to vote absentee by mail.

Overall turnout figures were six and five percentage points higher than in 2016. In November 2016, Anson County’s turnout was 61%; Mecklenburg’s was 67%.

In 2020, North Carolina’s presidential contest was so close that every county had to do a recount. It was an anxious time for elections officials. Melton and her staff fed all ballots through the machine again — a full day’s worth of work.

In a state colored red in presidential elections since 1980, except for 2008, both counties went blue in 2020, 2016, and 2012. In the past two elections, the counties’ different margins pattern the nation’s, i.e., rural locales gravitating more toward the Republican candidate and urban areas favoring the Democrat.

  • In 2020, Anson’s percentage for Democrat Joe Biden was 52%; Republican Donald Trump received 48%. Whereas Biden got 67% of the vote in Mecklenburg and Trump garnered 32%.
  • In 2016, 56% of Anson voters went for Democrat Hillary Clinton and 43% went for Trump. In Mecklenburg, Clinton garnered 62% of the vote and Trump received 33%.

Elections officials were under pressure after the November 2020 contests and, in Mecklenburg County, the tension seeped into 2021. Notwithstanding the national spotlight on people’s discontent — from the 2020 election, the ongoing pandemic, increased crime, school disruptions, and race relations — the 2021 municipal elections in both counties did not generate rousing turnouts. In November 2021, voter turnout was 13% in Anson and 15% in Mecklenburg. Whereas in November 2017, turnout was 12% in Anson and 21% in Mecklenburg.

North Carolina’s voting structures have been in flux of late, culminating in high-stakes court battles. In mid-September 2021, a panel of North Carolina judges blocked the state’s voter ID law requiring voters to show a photo ID, saying it discriminated against Black voters. The law was enacted in 2018 when the Republican-controlled state legislature overrode a veto by Gov. Roy Cooper, a Democrat. Republican leaders State Sen. Philip Berger and State Rep. Timothy Moore petitioned the U.S. Supreme Court in defense of the state’s voter ID law. On March 21, the U.S. Supreme Court heard arguments in Berger v. North Carolina State Conference of the NAACP about who has the right to defend the law in court.

Redistricting was also roiling the state recently, bumping forward the primary election from March to May because the maps were being contested. As of seven weeks before the start of the rescheduled primary voting season, the maps became clear. On March 7, the U.S. Supreme Court affirmed North Carolina’s congressional maps approved by the state court. The maps had been challenged by the Republican-controlled state legislature.

For the 2022 primary, featuring a competitive U.S. Senate race among other contests, early voting began April 28 and runs through May 14. Primary Election Day is Tuesday, May 17. Dickerson says he expects a robust turnout in Mecklenburg County.

How Internal Wealth Influences Communities’ Prospects Post-Covid

by Dante Chinni and Ari Pinkus May 11, 2022 Print


The Covid-19 pandemic has reshuffled the U.S. economy on a fundamental level. Everything has changed — from how and where Americans work, to the way they shop and entertain, to how they conduct business meetings. More than two years after the first nationwide Covid shutdown, movie theaters are still mostly empty, and many restaurants have not bounced back. Schools have largely returned to normal, but with an eye out for new variants. These are the kinds of large-scale shifts that are causing uncertainty and upheaval in communities across the country.

But all the changes have also unfolded on a very uneven landscape and have the potential to lead to vastly varied impacts on communities’ social and economic health.

The data show how some communities went into the pandemic with strong economies to protect them, while others started off with deeper challenges across many areas, from unemployment to income inequality to homeownership. Together, the numbers show just how complicated the road out of the pandemic will be. Like a relay race with a staggered start, some places have inherent advantages that are only likely to grow as the recovery unfolds and the worst parts of Covid drift into the rear-view mirror. Others are likely to find themselves not only trying to recover from the virus but also adjusting to the new world from a lagging position with little way to make up ground.

The data serve as a reminder that the national narratives coming out of the pandemic do not adequately explain what is actually happening on the ground in different kinds of places. And finding a “new normal” is likely to take much longer in some communities than in others.

For this report, the American Communities Project worked with the Economic Innovation Group to analyze asset income per capita across the ACP’s 15 county types. That is income specifically from dividends, interest, and collected rent. The numbers are a baseline for this report because they go to the heart of a broader question of economic health at the community level.

“The pandemic has underscored the divide in financial security and well-being between the Americans who own assets and those who do not,” EIG Research Director Kenan Fikri said upon the release of the organization’s asset income report in August 2021. “The overall economy is booming and asset prices are soaring, but many American communities are left out with little direct stake in the wealth created on financial markets. Building wealth inclusively will require expanded and innovative pathways to increase asset ownership for more American families.”

The larger truth behind these words still holds. The EIG analysis looked at asset income in the ACP types going back 50 years. During the last 10 years, a group of communities has emerged above others, showing steady asset income growth. The most urban community types, the Big Cities and Urban Suburbs; the agriculture-driven Aging Farmlands; and the Graying America retirement havens stand above the rest of the ACP types.

On the other end is a set of ACP types that lack those advantages, and most of them are home to large communities of color: Hispanic Centers, Native American Lands, African American South as well as Working Class Country and Evangelical Hubs. As those communities look to emerge from the pandemic, they not only lack that asset income stream but also face long-term challenges on issues such as child poverty.

The way those advantages and difficulties play out at the community level will be important for policymakers to understand as the nation adjusts to life after Covid-19. There won’t be simple one-size-fits-all answers, but solutions that draw on the resources of particular places and fit their demographics and terrains.

Dividends, Interest and Rent per Capita

= median
Note: Pitken County, Colo. ($98,480 per capita) and Teton County, Wyo. ($161,410) are excluded from the chart due to being extreme outliers.


To explore how these data fit with the strengths and challenges of the different community types in the ACP, we use the latest data from the County Health Rankings & Roadmaps in the second half of this report. We examine where each type stands on unemployment, poverty, income inequality, housing, and segregation.

Asset Income by ACP Type

If communities with higher asset incomes start off in a better position on the path out of the Covid-19 pandemic, the ACP typology points to a set of communities with a notable advantage. Four community types stand out among the 15 types. Urban Suburbs, Big Cities, Aging Farmlands, and Graying America all have a per capita asset income of $12,000 or more.

In some ways, they are curious mix of places. Big Cities and Urban Suburbs are often in close proximity in economic data. They tend to be home to more people with college degrees and higher incomes; greater population density; and bigger, wealthier employers. On issues of economic attainment, it is not common to have those two places grouped with rural communities, such as the Aging Farmlands and Graying America. What’s behind this peculiar alignment? Different kinds of people and assets.

It’s logical that the Urban Suburbs ($14,190 in asset income per capita) and Big Cities ($13,860 in asset income per capita) are the top two groups here. The assets being measured here are dividends, interest, and collected rent. And these communities are more likely to have people who own stocks and bonds, and people who own real estate.

The higher incomes in both community types mean people often have bigger investment portfolios. So as the stock market thrived during the pandemic (even as other parts of the economy stalled out), many people in the Big Cities and Urban Suburbs could log into their investment accounts and feel comfortable. Many residents in these communities also held the kind of jobs where “working from home” was an option, further insulating them from the worse effects of Covid-19.

Real estate is more complicated. Home prices and rents have skyrocketed in Big Cities and Urban Suburbs in recent years, and that may be a drag on the personal economic situations of some in these communities. But these same communities are more likely to be the homes of landlords who own rental properties in urban areas. So as housing prices and rents rise, that money largely stays “at home” in Big Cities and Urban Suburbs.

The economy of Aging Farmlands ($12,400 in asset income per capita) has long operated differently than that of the rest of the country. These communities are not focused on Wall Street but are built around agriculture. Although they rarely look ostentatious, there is a lot of wealth in them. Farmers aren’t just people who plow fields, they are extremely attuned to global commodity markets. Go to an Aging Farmland community, where the price of a bushel of corn or wheat is on everyone’s tongue or their smartphone screen. People in these places know returns can be about when futures contracts are signed and harvests are sold.

Land is an enormous part of wealth and renting plots — to other farmers or to outsiders as game refuges — can be extremely lucrative. In some ways, these communities may have been the most insulated from the short-term economic impacts of Covid. Add in the fact that “social distancing” is part of everyday life in these extremely rural places and their advantage grows.

Graying America ($12,390 in asset income per capita) may be the biggest surprise on this list, but it has a few big advantages in terms of asset income. First, many of these communities have become retirement centers for aging baby boomers. After years on the job, they take their accumulated wealth and stock portfolios to rural cities and towns they have come to know through vacations and weekend getaways. Look at the map of Graying America, and you’ll notice lots of places on water or in the mountains. These kinds of places catch the eyes of people with a few dollars, and suddenly more free time. (An analysis of the 2020 census shows about half of Graying American counties gained people in the last decade, bucking a larger trend of rural places losing population).

As those Graying America tourist destinations add people and grow in popularity, they have also benefited from the home vacation rental market. Short-term vacation rental income from sites such as VRBO have added greatly to the rental income of these communities. And during Covid, when overseas travel and even hotel stays were a no-go for many people, Graying America was a winner.

Second Tier

The next six community types bunch together, from just under $10,000 to just above $8,000 in asset income per capita. All these communities are comfortably middle-income, but felt the effects of Covid-19 differently, given their demographics and locations. The communities run the geographical gamut — from LDS Enclaves in the interior West to College Towns scattered around the country, Exurbs in the outlying suburbs of cities, Middle Suburbs ringing cities in the Rust Belt, Military Posts on and around bases, and Rural Middle America, encompassing 599 counties along America’s upper half from Maine through the Great Lakes to Montana to Washington.

The asset income per capita in College Towns is $9,998. These middle-income communities emptied out when Covid hit but have been coming back since the fall of 2021 with the widespread distribution of vaccines. As younger communities, they did not suffer the losses of more densely populated communities with a greater age range. These communities are also loaded with renters — college students, graduate students, and even professors stay for a few seasons, then move on.

In Exurbs, the asset income per capita is $9,350. Exurbs are considered relatively wealthy among the 15 types with some rural attributes. Here, residents tend to be more settled. Dividends and interest are common and important assets. During the pandemic, many white-collar residents were able to work from home, their retirement plans growing as the stock market soared. And newcomers bought homes, freed from the constraints of commuting to a downtown office.

Military Posts‘ asset income per capita is $9,320. Like College Towns, military communities are younger and more transitory. Government paychecks where money is invested in retirement accounts are the norm. In August 2021, the Department of Defense took steps to mitigate Covid effects, requiring all service members to be vaccinated against the virus.

Rural Middle America’s asset income per capita is $8,720. These places are defined by small towns, and like Exurbs, tend to have more established residents. Unlike Aging Farmlands, they are not heavily reliant on agriculture, but driven by a mix of ag, manufacturing, and services, which took a hit during the pandemic. Assets, of course, go hand in hand with people. Youth and older residents have been leaving these communities for more opportunity and a better quality of life; the 2020 census confirms a 0.3% population decline in the past decade.

LDS Enclaves’ asset income per capita is $8,480. These younger communities are the centers of the nation’s Mormon population — and they are growing. The 2020 census shows LDS Enclave growth at 17.7%. Twenty-nine percent of the population in LDS Enclaves are under 18, with fewer assets to their name yet. Only 14% are over 65, a population that tends to have more assets. In some parts, the tech industry is burgeoning. In 2021, Salt Lake City (in Salt Lake County, an LDS Enclave) was one of six cities to document “impressive” growth, according to a report from the Computing Technology Industry Association. The Silicon Slopes in Utah are concentrated around Salt Lake.

In Middle Suburbs, asset income per capita is $8,170. Middle Suburbs have been hard hit by the effects of globalization in the past 30 years. Manufacturing layoffs were constant in the 1990s and 2000s. Once heavily unionized, these communities have struggled in recent decades. They lack the high incomes and investment portfolios of other urban communities.

Rear Tier

Bringing up the rear are the communities of color — African American South, Hispanic Centers, and Native American Lands — as well as working-class white communities in Appalachia and the South, all places where long-standing structural inequities permeate daily life and robust economic development is atypical. Covid is among many ongoing difficulties. Of the 15 ACP types, Evangelical Hubs, Hispanic Centers, Working Class Country, and African American South counties have seen the least amount of change in asset income per capita since 1990, only rising $760 to $1,260 in 30 years.

Agriculture is a dominant industry in Hispanic Centers, where the asset income per capita is $7,300. Hispanic Centers are home for many younger residents and immigrants, some of whom are sending money earned from working on farms and in hospitality and meatpacking plants to family outside these communities.

Working Class Country’s asset income per capita sits at $6,770. Coal country has felt the loss of its dominant industry. Bright spots: These mostly white communities concentrated in Appalachia can be inexpensive vacation destinations, draws for their country settings and picturesque views.

Native American Lands have a host of difficulties that hold down their asset income per capita to $6,440. On Indian reservations, many people work in the underground economy and do not use banks or own much. Generational poverty is an ongoing challenge. A mindset of giving is also common here, one in which people share whatever they have with someone who has less.

The African American South’s challenges seem just as deep-seated. Here the asset income per capita is $6,180. These rural communities also lack economic development. Moreover, segregation between Blacks and whites remains a fact of daily life — and that includes assets such as rental income, dividends, and interest.

In neighboring Evangelical Hubs, the asset income per capita is the lowest of the 15 types at $5,960. In these older, white communities, religion is a pillar of life, but industry is scarce and infrastructure, including housing, is often subpar.

Diverse Socioeconomic Landscapes

The asset income numbers in the first half of this report offer a sense of the underlying resources in the ACP’s 15 community types, but those resources make up only a part of the picture of those places. The community types sit in distinct socioeconomic landscapes that lead to different underlying strengths and challenges. To understand those landscapes, the ACP worked with the County Health Rankings & Roadmaps, analyzing the CHRR measures through the ACP typology.

This section examines what those measures can tell us about four major areas: unemployment, poverty, housing, and segregation.

Unemployment and Labor

Most of those who have paid attention to the economic impacts of Covid-19 know the story of unemployment. March 2020 brought a massive shock to the system when the nation ground to a halt and businesses shuttered — some temporarily, some permanently — as the parameters of the pandemic’s effects became known. A large portion of the population went on paid and unpaid leave and then, slowly, they went back to work, many from home. Others waited, unsure of whether and when it was safe to return to work.

But the impacts across the ACP’s 15 types were very uneven. Some communities have a greater share of jobs that can be shifted to “work from home” than others. Some rely more heavily on tourism dollars. And some communities consistently have lower unemployment rates than others simply due to their employer base.

To gain a solid understanding of what happened by community type, you have to consider two factors: the unemployment rate and the labor force figures. Since the unemployment spike that arrived with Covid in 2020, the numbers have improved dramatically, back to near pre-pandemic levels. But in many cases, that drop has happened with fewer people in the workforce — that is particularly true in some community types.

Comparing February 2022 (the latest data) to February 2020 (the last month before the pandemic hit), you see that the unemployment rates dipped in almost half of the ACP types.


The Native American Lands have seen the biggest decline, with an unemployment rate that has dropped by 0.7 points. LDS Enclaves and Aging Farmlands have also seen big drops, more than half a percentage point, in that time. Those types are among the most rural ones in the ACP. However, simply saying “rural communities weathered Covid better” misses some big differences in those declines. Even with the declines, Native American Lands still have a relatively high unemployment rate, 6%, meanwhile LDS Enclaves and Aging Farmlands have the lowest unemployment rates in the ACP, both under 3%. The point: Simply measuring the change in the unemployment rate misses a lot of subtlety. (More on that in the discussion of labor force.)

The data suggest urban places have had a tougher time getting back to their pre-Covid norms. The Big Cities alone have an unemployment rate that is a full point higher than it was in February 2020. Some of that increase may be due to offices still being largely empty in many major cities — meaning there is less need for services (cafes, restaurants, etc.) around them. The Urban Suburbs have also seen a jump of half a point and the Exurbs are up 0.3 points. Those increases are somewhat surprising considering those communities are generally home to more college degrees and white-collar jobs (the kinds spared a lot of loss during the pandemic). But the data indicate the economic pain may have been more widespread than understood in most analyses, with service sector job losses being widespread.

The numbers also point to BIPOC (Black, Indigenous, People of Color) communities being hit harder than other places in the pandemic. African American South counties and Hispanic Centers tend to be more rural than others, but they still saw significant increases in unemployment compared to their less racially diverse rural counterparts, such as Rural Middle America and Evangelical Hubs.

And none of that takes into account the change in labor force numbers that have become a big part of the Covid economy story. Two-thirds of the ACP types saw a drop in their labor force (the number of people actively looking for a job) in February 2022 compared to February 2020.

Big Cities and Urban Suburbs lead the way for the largest drop in the workforce. Some of that is to be expected because they hold the most workers, and as mentioned above, their economies took hits in the service sector.

The most prominent dip, however, may be the small-town Rural Middle American communities. Those counties have less than a third of the population of the Big Cities and Urban Suburbs, but their labor force reduction was almost the same size, about 216,000 fewer people.

Again, there are signs in the labor force data that some rural communities may be rebounding a little better than the nation as a whole. Of the five communities that saw an increase in labor force, four of them — Aging Farmlands, Graying America, LDS Enclaves, and Military Posts — generally have lower population densities.

In terms of adding workers, the biggest winner was the Exurbs. The counties, generally on the edge of urban areas, added almost 400,000 workers. They may have gained from workers commuting to cities less frequently and using services more closely located to their homes.

The labor force numbers also suggest that communities of color have had a harder time recovering from the Covid. The three ACP types with large communities of color all experienced drops in their workforce: the African American South, Hispanic Centers and Native American Lands. Although the drop in the Native American Lands is the smallest, it is the largest as a percentage of its workforce — eliminating the gain those communities made in their overall unemployment rate.

Income Inequality

In many communities, the question of resources is complicated by the fact that they are spread out unevenly. That means that even if a community looks healthy in the data, on the ground there can be vast differences between haves and have-nots that require more spending on social programs. The CHRR measures income inequality by measuring the ratio of household income at the 80th percentile to income at the 20th percentile. There are stark differences within the ACP community types. The numbers range from a low of 3.8 in the LDS Enclaves to high of 5.2 in the African American South and Native American Lands.

There are some surprises in the numbers here.

It is often assumed that more urban areas have higher amounts of inequality as they are generally home to great wealth and great poverty. And there is some evidence for that in these figures. The Big Cities at 4.7 and the Urban Suburbs at 4.6 have some of the higher inequality scores.

However, the highest numbers here belong to two rural community types with large BIPOC communities: the African American South at 5.2 and the Native American Lands at 5.2. (It should be noted the Hispanic Centers are lower at 4.5.) Those figures suggest that a big part of economic inequality in the United States is tied to racial and ethnic disparities. It also suggests that coming out of the pandemic, rural communities may need special attention.

It also should be noted that racial and ethnic homogeneity may play a role in lower economic inequality figures. The two community types with the lowest inequality scores — LDS Enclaves and Exurbs — are a mix of suburban and rural locales. However, both are much less racially and ethnically diverse than the nation as a whole. And LDS Enclaves and Aging Farmlands are both more than 85% white, non-Hispanic.

Child Poverty

The CHRR data show radically different situations for child poverty in the ACP types, from a low of just 11% in the Exurbs to a high of 31% in the Native American Lands. In the context of other challenges during the pandemic, from schooling to unemployment, these numbers indicate the disparate community needs coming out of Covid-19.

There is, again, clearly a racial component to these data. The community types with large BIPOC populations — the African American South, Hispanic Centers, and Native American Lands — all have child poverty figures at 20% or above, and in the African American South and Native American Lands, the figure is around 30%.

The challenges in rural communities are apparent in these data as well. Two other communities have child poverty figures above 20% — Evangelical Hubs and Working Class Country — and both are predominantly white, non-Hispanic, but also largely rural.

No amount of child poverty is a positive, of course, but urban communities generally fare better on this measure. Exurbs, Middle Suburbs, and Urban Suburbs are in the top half of the ACP types of child poverty. Even the densely populated and economically diverse Big Cities are below 20%.

As the nation slowly works its way back to a new normalcy, those differences will be important to keep in mind. The challenges of urban youth tend to grab national attention, but it’s clear that rural communities face their own obstacles. And, as noted above, these are the same kinds of communities that lack internal wealth, which would help to climb out of the damage Covid has wrought. They have lower asset incomes and lower household incomes.

Housing

In another facet of community internal wealth, homeownership tends to be highest in communities with older, settled, white, and rural residents. The highest median homeowner rates are in Appalachian-based Working Class Country; middle-income, younger LDS Enclaves in the interior West; Exurbs, now popular places to raise families outside cities; and overwhelmingly white and land-rich Aging Farmlands in the plains. All stand at 77%, according to the County Health Rankings & Roadmaps. Older white rural communities, Rural Middle America and Graying America, come in close behind at 75%.

Homeownership drops precipitously in cities where population density is greatest, and owning property is at a premium. Overall, ownership is lowest among diverse, stratified, transitory, younger communities: Big Cities at 55%, College Towns at 62%, Urban Suburbs at 64%, Native American Lands at 65%, and Military Posts at 66%.

Furthermore, communities where homeownership is low often face severe housing problems, i.e., “at least one of four: overcrowding, high housing costs, lack of kitchen facilities, or lack of plumbing facilities,” according to the County Health Rankings & Roadmaps. Native American Lands and Big Cities endure the highest rates of severe housing problems at 19%; Urban Suburbs, the suburbs closest to cities, come in at 17%.

Residential Segregation

Moving beyond the home, the experience with residential segregation can be vastly different depending on the kind of community in which one lives. Segregation between whites and nonwhites tends to be greatest in more densely populated places: Middle Suburbs’ median segregation index sits at 42, Big Cities at 40, and Urban Suburbs at 38. The exception is in rural Native American Lands, where the indigenous population typically lives apart from whites. It has the highest segregation rate at 48.

Segregation between whites and nonwhites is lower among more homogenous or planned communities with Aging Farmlands, Graying America, LDS Enclaves, and Military Posts at 29, and Exurbs at 31.

In an interesting finding, Hispanic Centers — where self-identified Hispanics make up an average of 56% of the population — have the lowest segregation rate among community types at 23. This figure accounts for the demographic distinction between non-Hispanic whites and Hispanics. So it’s possible to see such a low number in this dissimilarity index because an overwhelming number of people self-identify as Hispanic in some counties and/or there’s a very high reliance on agriculture, a more integrated field.

Residential segregation between whites and Blacks is highest in predominantly white, middle-income communities in the Northeast, Midwest, and interior West: LDS Enclaves at 75 and Rural Middle America at 61.

Racially diverse and densely populated places are much lower on the index, with Big Cities at 54 and Urban Suburbs at 53. Perhaps it’s surprising that the African American South has the lowest rate of Black/white segregation at 35. This might be partly because these counties have fewer residents, and homes in these rural locales are scattered, with fewer planned neighborhoods. It’s important to note, however, that daily life in the African American South is often segregated.

The connection between communities’ internal wealth and segregation of racial/ethnic demographic groups is an area ripe for further study.

In Working Class Country, Shifting Views on Covid-19 and Its Vaccines

by Ari Pinkus March 02, 2022 Print

Beautiful Lake Missaukee in Michigan in February 2022. Photo by Brad Seger.

In Working Class Country’s Missaukee County, Michigan (pop. 15,052), Covid-19 has taken its toll in significant ways. Since the pandemic began, the close-knit county has had 2,878 cases and 59 deaths, according to USAFacts. Among those who died were Dave and Paul Ebels, brothers and community pillars. Their deaths in March and April 2021 deeply upset residents and spurred many to get vaccinated. As of late February, 52% of county residents have received one dose of the vaccine, and 49% are fully vaccinated, according to the Times Herald.

One of the newly vaccinated is Lake City’s former mayor, Brad Seger. I spoke to Seger about how he and the community have been coping with the pandemic, from mental health concerns to vaccinations, school disruptions, civic engagement, and keeping faith.

Community Culture

It’s a farming community in northern Michigan. And well, it’s traditionally been 75% Republican voting. It’s a wonderful community. It’s a very generous community. I mean, it’s a poor county, there’s certain parts that are very poor, but I guess the generosity of the people here is, well, it’s overwhelming to me a lot of times.

Dealing with Covid-19

I've seen very bad consequences. I’ve seen neighbors go against neighbors. Half the community didn't really believe in Covid. They have more and more when it started killing younger residents of the community.

But when it first started, it seemed to me half the community took it very seriously. And they locked down. The other half did not lock down; they went about their regular business.

But as the months have gone by, especially the people that locked down, I see they went from great, wonderful people to seeming angry all the time, because they're hermits. They just stay home and do nothing. They hardly have any social interaction.

I was the mayor until last November and I never saw anything like that. People would come in and be angry over the simplest of things with their neighbors. Yeah, it's been a horrible thing. It still is.

I'm not mayor anymore. I lost by 13 votes, no big deal. I did it for nine years. It was a wonderful job. It is a really small town. They paid me $100 a week, and I did a great job. But when Covid started, it just wasn't fun anymore. I had more and more people, whether they were in council, or coming in with their own personal expensive agendas. And I tried to explain this is tax dollars. We need a return on investment; we have to at least think that 70% of the city residents are happy with what we're doing here. To me, everybody just seemed to be changed.

Religion’s Role in Community

Saint Stephen's Catholic Church in Lake City, Michigan. Photo by Brad Seger.

Of course, they shut the churches down for a while, but they're all open now. There's a lot of churches in our community. It's a very religious community. But I'm not sure how the churches have helped.

I've always had faith in Jesus Christ and my faith has been where I didn't lock down. I was out and about with all my regular friends, and I showed up at all the council meetings. I was one that just felt, if it kills me, then; if it doesn't kill me, then it makes me stronger. I really wasn't afraid of Covid, especially in the beginning. I did not get my vaccines. And I had Covid in my house. I have children; they tested positive and their friends would be here.

You asked if the churches have much of an impact. I'd like to say yes. But I'm just not sure if they have had a big impact.

Brothers Who Lost Lives to Covid-19

Well to me, they're kind of superstars. They had the big Ebels hardware store and, of course, their brother is still alive. He had the grocery store right beside them. But the two that had the hardware store, they just had a great business. Every time I’d see them, they just seemed healthy, strong. And they were very well known to the community. They were just God-fearing, wonderful people. It was a big shock. And one was 52 years old and one was 57. So it was a shock that for two somewhat young gentlemen like that, Covid killed them.

Deaths’ Effect on the Community

There was great mourning. It was a very sad time. I will say the brothers were kind of like me. They didn't think Covid could really hurt them bad, let alone kill them. Any time I went out there during Covid, nobody was wearing masks. I guess it really wasn't mandatory but certainly was mandatory in our schools.

But in that farming community out there, I felt before the Ebels died, they didn't take Covid very seriously, but I believe they did after the two Ebels gentlemen passed.

Changing Mindsets and Behaviors on Vaccinations

A lot of people, including me, went and got their vaccines. You know, when [the brothers] passed away, again, I hadn't gotten my vaccines, and I still didn’t for several months after. But I certainly thought about it more. I'm 61 years old. So I just thought if it’s going to start killing people at that age…. And I always question myself, ‘Why are you not getting your vaccine?’ Certainly in the beginning, we don't buy a new model car off the lot. We just want to see how it's going to work out. Is it going to have lots of kinks in it?

I wanted to wait a certain amount of time just to see side effects or anything negative. Now the vaccines have been out and millions of people have gotten the vaccines. But when the Ebel boys died, yeah, that really made a lot of people think, and they went out and got their vaccines.

I had a few other friends in their 60s that passed from Covid. And, of course, I've heard of other people in other communities where it’s even killing people 39 [years old] and 40.

And I still was hesitant. When I was mayor, certainly people would come up to me and say, ‘Brad, have you had your vaccines yet?’ And I said, ‘No, I haven't.’ And they said, ‘Well, why?’

Yeah, I really didn't have much of an excuse. So I went and got it, and for personal reasons, too. One friend of mine at 66 years old was in the hospital, and two days before he died said he wished he would have got his Covid shots. So that was a big one too, along with the Ebels and lots of other people.

Boosters and Being Cautious

A lot of my friends took Covid seriously. Some had COPD in their lungs so they really didn't go anyplace but the grocery store masked up, and they're still taking it seriously. Oh, they got their shots right off the bat, and booster shots as soon as they were eligible.

They still don't go out to the area because at our school, our basketball games, volleyball games, nobody’s wearing masks and the gymnasium is full.

Vaccinations In and Beyond School

Some [students] but not many [are vaccinated]. Very few will wear masks since it’s not mandatory. And I'm quite sure it's not mandatory for school teachers to get their shots. I think a lot have since they've seen the studies that there really aren’t side effects and side effects are very, very rare. So I think more and more people got their shots as time went on. I mean, even some diehard guys that were not going to get their shots have gotten their shots now. Not all of them. But even the ones that are still adamant about not [getting them], they struggle with whether they should or shouldn't.

On Schools Closing and Reopening

When they shut the schools down for a while, I thought it was horrible. It was horrible for the children, the parents, and everybody. But I certainly understood; there's a lot of older teachers, same thing with the colleges. There's a lot of older professors and again, they like the online. Not that it's easier for them, which it may be a little bit, but I think they were scared of dying.

Schools have all been open for quite a while, and Covid’s rampant. I get the kids coming home all the time. It's interesting, though, for the children that play sports. Teachers and coaches certainly don't say don't get tested. But it's kind of known, please don't get tested, or we're not going to be able to play anymore.

My son graduated last year. He's at MSU. But both his football and basketball seasons got cut short, just because one kid went and got tested. He was with the whole team, so half the season was shut down.

It wasn't super long that [schools] were closed down, but I just remember the time. I got a 14-year-old, [who was] 13 last year. I mean, she'd want to fall asleep on the Zoom or she’d mute it. We’d get a call from the teacher and it was bad. I didn't lock my kids down. Any time they wanted to go with their friends and stuff, go. It was just a certain number of them that all hung out together. And I saw it wasn't killing children. We told them stay away from the older people and grandmas and grandpas, but the lockdown, the homeschooling deal, I thought it was horrible.

Talking to the school superintendents and principals, they had it very tough. It seemed half the community wanted to close the schools. The other half of the community were hollering this is not healthy for our kids. They're not learning anything.

Community Divides

I think [the divides are] easing. If you don't want to get your shot, I have no problem with that. I'm certainly not going to get ugly with you about that. Where some people were. I think that's eased up because a lot of people have gotten the shots. And then they know, too, that if they didn't get the shot, they can stay home. They don't have to go out and be around people who haven’t had their shots.

Residents' Concerns Now

Well, I think [they’re] still the same. You know, they want good roads and safe neighborhoods.

Civic Engagement

It does seem that more and more people are showing up to school board meetings, they're showing up to city council meetings, they're showing up to county commissioner meetings. Not lots.

But yeah, I've never seen so many people vote at our local election, as I saw last November. There was a good man running against me; he’s a friend of mine. I was very happy for him. And he did a political thing. He put signs everywhere and took out ads in the paper and stuff. But I was shocked at how many people came out and voted. And I thought I was going to get smeared. But it was a very close race.

I didn't really campaign much at all. We had three council seats open, too. I've never seen so many residents come out and vote. So yeah, people feel they can change things.

Issues Surfacing In Meetings

Well, again, this is a really small city. The population’s 837, according to Google from 2017. A certain number come in and want this and that. But that's not what the whole community wants.

Blight is a big one, where poor people have a camper in the city, and they use that camper to go locally, but it's not a really nice camper. [Some people] don't want that sitting in the yard. They want to make it into a Richie Rich community.

And that's the new mayor. He’s one of the richer people in town. He was born and raised here. But he came from a rich community when he was working. So they're going around, calling different poor people, saying you have to do this and that. I was against it; I certainly told them the city should never hire an attorney to go against these people. But that's a big one — they’re picking on the poor people. And we should never pick on the poor people. God frowns on that.

Searching for Hope

Brad Seger, former mayor of Lake City, Michigan, with his brown trout in April 2021. Photo courtesy of Brad Seger.

This summer there was hardly any Covid around at all. So I had hope mid-summer because we opened everything up. We had our Fourth of July celebrations, which we didn't have the year before.

But now with all these other variants coming, it seems like half the community is sick and just can't get better. I feel Covid is going to affect them forever — like they still have a cough, and just can't seem to get back to 100%, including me. I mean, I feel pretty good. But I still have a cough. I'm a cigarette smoker so is it because of cigarettes or Covid.

So hope for me and the community is kind of low, mainly because of Covid.

Turning to Faith

I pray a lot. And it's not just about Covid. But for a lot of people. I'm not afraid to die. So it's not like I pray that Covid doesn't kill me. But I do pray for other people's health.

I mean everybody's looking for just a little bit of peace on this earth. And that's what I try to push to anybody that I have conversations with. Just do unto others as you would do unto yourself. It's as simple as that.

The Pandemic and Deaths of Despair in Western Pennsylvania

by Ray Suarez February 15, 2022 Print

Editor’s note: The piece focuses on the Middle Suburbs because of the high rate of Deaths of Despair in these communities compared to much of the rest of the country. In the ACP typology, those counties come in just behind rural communities such as Graying America and Native American Lands. Ray Suarez visited Westmoreland County, a Middle Suburb in Pennsylvania, to get the on-the-ground view of the story.

When the pandemic hit, doctors, researchers, therapists, and law enforcement held their collective breaths. Deaths of Despair, the name widely used to describe early death due to suicide, substance abuse, and untreated mental illness had soared over the previous 25 years. What would a pandemic already bringing widespread social and economic impact to communities across America mean for people struggling with hopelessness, for people ready to give up?

The first signs were encouraging. Though the pandemic pushed down the accelerator on some of the drivers of Deaths of Despair like job loss, reduced social contact, and health problems, the numbers did not appear to take off. Laurie Barnett Levin, CEO of the Southwestern Pennsylvania Branch of Mental Health America, feared the worst, yet early on it didn’t seem to be materializing. “We really thought that as a result of the pandemic we would see a huge spike in deaths, deaths because of suicide. And that didn’t happen. And we couldn’t figure out why.

“And some of the hypotheses are that during the pandemic, people were sequestered together. They couldn’t go out, they couldn’t do things, and in a strange sense that was a protective factor because they were with other people.” Suicide is often carried out in solitude.

Barnett Levin said adjusting to challenge also acted as a helpful form of diversion. “Sometimes when you’re in the fight or flight mode, because it’s a crisis, your focus is on the crisis. It diverts your focus from what’s going on inside of you. You’re so busy in that survival mode: Your family. Where am I going to get my toilet paper? Where am I going to get food? You’re thinking more about those things. In a way it’s a kind of mindfulness activity. Your focus is more on those kinds of things, and your family’s all around you. And often Deaths of Despair take place when the person is alone, by themselves, and during the pandemic there was not that much alone time.”

Even before the pandemic, the Middle Suburbs stood out in the ACP as the one metro-area community type that had high rates of Deaths of Despair. The figures in those counties were much higher than the numbers in the Big Cities, Exurbs, and Middle Suburbs. The last two years have only made the situation more challenging in the blue-collar communities around Pittsburgh and other places like them.


Microcosm of the Middle Suburbs

The social landscape, however, built in certain realities that leave Westmoreland County, like much of western Pennsylvania, vulnerable. In “Deer Hunter” country, as in so many places in the U.S., guns are a common tool for suicide, said Barnett Levin. “You put that together and homes where gun ownership is very common, multiple gun ownership is very common, and then you take the people that might be depressed, and I'm stereotyping, but men are often not the ones that reach out the most, and sometimes this is seen as a sign of weakness. So I think those are some of the reasons, and I think that it does follow national trends. There's certain groups, as you probably know, that are at risk, like veterans. The elderly are at risk, LGBTQ population, and they also have seen recently the rates are rising in African American young males.

“But Westmoreland County is a homogenous type of county (93.7% white in the 2020 Census). But we see the veterans. People who are experiencing financial hardships. During the last recession, when it first started, we were astounded because we thought we were going to see more death from suicide, and we didn’t. But a year or two later we did.”

After the first lockdowns, the pandemic devoured the rest of 2020, marched across 2021, and stretched into 2022. Anxious workers yearned for a return to their routines. Schoolkids attended on-again, off-again in-person instruction as the number of infections among young Americans rose, and the death toll continued its rise, with U.S. Covid-19 deaths likely to reach 1 million later in 2022.

Westmoreland County, Pennsylvania, is a good place to watch for developments. Here, both the pandemic and Deaths of Despair have hit particularly hard. The county’s population has declined slightly during the last decade to just over 354,000. Deaths of Despair occur at a rate of 74.8 per 100,000 residents, compared to 64 per 100,000 residents in next-door Allegheny County and 52.8 per 100,000 in eastern Pennsylvania’s Bucks County. With a vaccination level below the state and national averages of just 57.5% fully vaccinated, 192.6 Westmoreland residents per 100,000 have died from Covid, compared to significantly lower 141.4 per 100,000 in Allegheny County, home to Pittsburgh.

The low rate of vaccination, as in counties across America, correlates with high support for Donald Trump in the 2020 presidential election. The incumbent carried Westmoreland County by 28 points over Joe Biden. In Allegheny County, where the vaccination rate is higher and the rate of Covid death much lower, Joe Biden won by 20 points on his way to a narrow victory in Pennsylvania. In Westmoreland, vehicles flying Trump banners also carry bumper stickers cursing federal government infectious disease specialist Dr. Anthony Fauci, or proclaiming the driver’s unwillingness to be vaccinated, like a large drawing of a syringe covering a rear windshield carrying the slogan “I WILL NOT COMPLY.”

I spoke to psychiatrist Dr. Jonathan Metzl of Vanderbilt University, author of “Dying of Whiteness,” earlier in the pandemic, when its effects on Deaths of Despair were still unknown. Now, almost a year and a half later, vaccine resistance fell right into place with his wider set of conclusions about the politics of health. “Part of the issue for me is just how profoundly performative health politics have become forms of identity. In other words, to be a white, rural, Republican voter is to perform a particular set of health practices that involve arming yourself, and rejecting Covid science. This groundwork had been laid down for years. This groundwork was laid down in response to the Affordable Care Act, where to be a good conservative in your own community you had to reject your own free health care as a way of showing your tribal membership.

“What it means to be a white, conservative, rural voter right now is to reject Covid science, with profound implications.” Metzl worries about social cohesion, the willingness to trust research, and the many months of the pandemic yet to be gotten through. “The mistrust of traditional expertise is so great, and there’s a whole industry that’s popped up in its stead to fill that void.”

Largely rural and suburban, overwhelmingly white, hugging the median line for income in Pennsylvania and nationwide, it could stand in for a large number of hometowns across the mid-Atlantic and into the Great Lakes, home to a majority of the counties that make up the Middle Suburbs. In Westmoreland County, small communities cluster on two-lane country roads that suddenly jump up hillsides, make a quick semi-circular turn and plunge into an unexpected valley. It’s rural to the east, and more suburban in the western townships bordering next-door Allegheny County, home to Pittsburgh. The county seat, Greensburg, looks like a lot of places in the long arc of fringe metro area counties from inland New England, across upstate New York, into Ohio, Indiana, and Illinois. The main commercial street features empty storefronts, pandemic-distressed businesses wrestling with reduced street traffic, closed and repurposed churches, and a magnificent 1906 courthouse stands at the summit of several major streets, giving it a commanding vista of the surrounding city.

Westmoreland County Courthouse. Photo by Ray Suarez.

To those working closely with at-risk Pennsylvanians, the early signs were not encouraging. Tony Marcocci, a detective with the Westmoreland County District Attorney’s office specializing in drug enforcement, saw problems emerge as the novelty wore off and the pandemic shutdowns and slowdowns dragged on. “Working in Drug Court affords me the opportunity to talk to a lot of people in recovery. When we were talking to people, not only in recovery but in active addiction, I noticed that everybody was going to remote NA meetings (Narcotics Anonymous, a 12-step recovery program). The meetings were on WebX or Zoom, individuals were losing their personal contact, which is so valuable in recovery, and oftentimes as a result, they were backsliding into using.”

From decades working with addicts, Det. Marcocci said not only were in-person meetings vital for encouragement and accountability, but also because they formed a social core around which informal links, connection to normal life, was built. “It’s more than just a meeting per se. So many individuals who attend meetings do stuff afterward, for lunch, for dinner, a movie, whatever. That was all taken away from them, that physical interaction was missing, so we saw so many people backsliding.”

The Economic Landscape

From economists Angus Deaton and Anne Case, whose groundbreaking work identified and measured Deaths of Despair as a social and economic phenomenon, to insurance companies to doctors to elected officials, the role of money has been watched closely as the death toll surged. Westmoreland County saw its fortunes decline like many other counties clustered in southwestern Pennsylvania, abutting other Deaths of Despair hot spots in West Virginia and southeastern Ohio.

The median annual household income, just over $60,000, is below both the Pennsylvania and national medians. The median age, at 47, is almost a decade older than the median age in the U.S. as a whole, clustering the county’s population heavily in the age cohorts particularly vulnerable to Deaths of Despair in Pennsylvania and the U.S., 45-54, and 55-64. Three out of every four housing units is owned rather than rented, with the purchase price well below the national average. Public transportation is sparse, leaving people without access to a car marooned in small communities far from shopping, medical care, employment, and school.

It’s a list of factors that are common in many Middle Suburb counties — and there are economic points as well.

The county’s main employers are no longer the coal mines, steel mills, and glass factories that built a secure blue-collar middle-class life. In 2022, the three largest employers in the county are Walmart, state government, and UPS, the parcel shipping service.

Thus, the pandemic brought a mixed bag for Westmoreland workers. Supermarket employees were classed as essential workers, shoppers retreating from retailers kicked parcel shipments into hyperdrive, and government workers were sent home in the thousands, and largely protected by collective bargaining.

Det. Marcocci said the economic trends had a strange, perhaps counterintuitive impact on the illicit drug economy. He says various kinds of state and federal emergency transfer payments put more money in people’s hands very quickly, and he saw the impact immediately. “Covid money was out there from the government. And in Westmoreland, used car sales skyrocketed.” The detective explained what seemingly unrelated data points meant to his work. “We border Allegheny county, which is Pittsburgh. For opiates, for sure, Pittsburgh is our source city. Most of the addicts travel to Allegheny County to get their supplies. With vehicles they were able to travel to Allegheny County more frequently, and now they had the money to obtain larger quantities.” Covid money, he said, spurred developments in the illicit drug trade. In Westmoreland County that meant increased access to methamphetamine, heroin, fentanyl, and prescription opioids.

Marcocci said more supply encouraged casual and marginal users off the sidelines. “The people that were trying to get clean or maintain cleanliness, people that were in drug court or trying to stay clean, saw this happening. So it’s in their face more. There’s more of a tendency to use when more people around you have it or are using. There’s more temptation to use.” Patterns of illicit drug use are shifting in response to purer, stronger drugs in the pipeline. Addicts who once favored one class of drugs and shunned another, think depressants versus stimulants, are moving to more than one class of drug as insurance. If a heroin user now fears overdose, he might take methamphetamine early the same day to hedge his bets against a dose that might otherwise kill him by suppressing heartbeat and respiration.

The Opioid Epidemic

Before the pandemic began, Pennsylvania’s governor, Tom Wolf, issued another disaster declaration, the fifth in a series, as opioid deaths spiked. Agencies across the state saw continued rises in the number of emergency uses of naloxone, a drug that heads off overdose deaths, and more babies born in the state’s maternity wards in withdrawal from drugs. These signs were abundant even as law enforcement across the state destroyed more than 250 tons of drugs collected in so-called “take-back boxes” installed around the state to keep prescription drugs from being diverted into underground markets.

Timothy Philips is executive director of the Westmoreland County Drug Overdose Task Force. He said he has also seen increased opioid supply, and family stress from the pandemic. “I think that just with the issues out there and people having problems and the uncertainty, it just sometimes seems so bleak. I think we're going to see an increase in behavioral health issues.

“I did a training with our Headstart staff. Headstart deals with little preschool kids. I couldn't believe some of the stories teachers were telling me about the behavioral problems and the issues with families and drug use and the kids and it’s just...heartbreaking. So I don't know if I'm just more aware of that now, or yeah, I mean we've provided the teachers with Naloxone and Narcan. We did a training for them too, because they have seen some overdoses with families in their facilities. Parents, grandparents using, whatever it was, and so yeah, I think it's going to even have a generational effect when we're talking about these young kids.”

The Mental Health Pandemic

Laurie Barnett Levin echoes concerns heard in other places in the country, and widely throughout Pennsylvania: The impact of Covid will continue well in 2022 and beyond. “We still think that we're going to see people who lose their lives to suicide increase. There’s a pandemic within a pandemic. That pandemic is the mental health pandemic.” She said the county’s available mental health service were already working at full capacity before the novel coronavirus came to this country, and everything has continued to get worse since. Barnett Levin noted that many industries have worker shortages right now, but “it was true in behavioral health before the pandemic. It has to do with salaries, it has to do with reimbursement, it has to do with paperwork, bureaucracy, so that you see that there are less people going into the field and you have people that are beginning to retire.

“In the more urban centers, you're more likely to find psychiatrists, but as you move out from the urban areas, you're less likely. And that is true in Westmoreland County, it's a big challenge to find psychiatrists who are the ones that are prescribing the medications. There's also nationally a tremendous shortage of child psychiatrists, and that's exacerbated in the more rural, semi-rural areas. Telehealth has helped with some of that, but it's still very difficult. There's waiting lists for people to get into treatment, and some of it has to do with people are increasingly now tending to their mental health, seeking services. The CDC did a study where there was a 30% increase in anxiety and depression brought about by the pandemic. So you're seeing more people trying to seek those services and less availability to have those services.”

Phillips said low pay and high pressure have combined to make the county’s efforts less effective. As part of a statewide effort to make drug counseling more available, he said, “Thousands of people in recovery were trained to be certified recovery specialists. Most of those people remain unemployed, or get into the field for a short time only to get back out because they can't make an adequate living. “You can't live on 10, 12 bucks an hour. And so we need to talk about developing the workforce, we need to be able to have the insurers pay for these services too. This is important stuff. It's about life and death, just like any other medical condition.”

Pennsylvania Studying Deaths of Despair

Befitting a place facing a particularly acute local version of a national challenge, Pennsylvania has devoted considerable resources to the task of understanding its causes, its scope, and its possible responses. Large insurers have teamed with Penn State University and state government to create a large and growing body of ongoing research into Deaths of Despair and their prevalence in Pennsylvania.

Dr. Lawrence Sinoway is a cardiologist, a distinguished professor of medicine, and director of the Penn State Clinical and Translational Science Institute. He has been studying Deaths of Despair for years, and is frustrated. For Sinoway, the social science and the research are solid, the medical evidence convincing, but his own profession is lagging behind. “Just the idea that if you talk to a psychiatrist about the definition of despair, they say it doesn't exist. There is no psychiatric equivalent of despair, the sense that it's greater than depression, it's constant impending doom. That doesn't exist necessarily in some of the medical stuff. So that is a major challenge. And what I see is a big problem, is what do you teach medical students about this? Right now we don't really have a curriculum. I'll give one talk with a couple of people. And wrap it around social determinants of health, but it's a much bigger issue.”

Highmark Inc., one of Pennsylvania’s major private insurers, does not need convincing. The company has funded extensive research into the chronic suffering and thousands of years of lost life accumulating across its coverage area. Sinoway knows there is a lot more research to be done, but said he has come away from the data sets convinced that if anything, the level of Deaths of Despair in Pennsylvania is underreported. “We took the electronic medical records or the claims data from Highmark and looked at 12 million people, and looked at the incidents of diagnoses associated with alcohol, associated with overdose, and associated with suicide.

“We found that this is exploding over the last 10 years. You can look at disease over time and show that things associated with it are increasing. You can show that from the early 2000s there is an increase in death and increases in diseases, so I believe it’s likely we’re underreporting both diseases and death.” Yet even a quarter century into the rapid rise of these deaths, Sinoway said, it still seems like early days. “When you talk to people in the state health department or in other hospitals and you talk about this despair, they say, ‘Oh, that’s a great name for it. I never knew that existed.’”

Integrating Social and Economic Data into Community Well-Being

Sinoway’s co-lead at the Penn State Clinical and Translational Science Institute, Dr. Jennifer Kraschnewski, told me more data is available on more aspects of America’s health than ever before, but they have not been as valuable or useful as they can be because they are not integrated. She said she is looking ahead to when “we can layer things that look at socioeconomic factors or variables, look at community aspects like organizations or churches in the community, looking at economic variables. And then combine these all together in a way where we can understand community risk factors and protective factors may look like, and how that interplays with the community’s health, not necessarily at an individual level, but more so at a population health level. How does that all work together and how do we make sense of things that you have to have a broader view to understand?”

At a moment in health care when so much is measured, and computers get more powerful by the day, we may also be inching closer to a time when the things we already know about towns and cities, counties and regions, can direct resources and help to head off Deaths of Despair before they happen.

Ray Suarez is co-host of the public radio program and podcast World Affairs, and covers Washington for Euronews. He is the author of three books on American life, most recently Latino Americans: The 500-Year Legacy That Shaped a Nation.

Documentary Short: Teen Suicides in Rural America

by Dante Chinni February 07, 2022 Print

As part of its ongoing study of Deaths of Despair in America, the American Communities Project visited Livingston, Montana, in Park County last summer for a deeper exploration of the nation’s teen suicide epidemic. Along with the ACP’s usual efforts of data analysis combined with sit-down, face-to-face interviews, this trip included a camera team. The result is the short documentary above. The work follows a written analysis of the topic this past fall and represents the ACP’s first foray into the documentary space.

ACP Director Dante Chinni, Producer Allison Sandza, and Cinematographer Zach Wood spoke with people across the community who have dealt with the problem firsthand and talked about steps they have taken to address it.


In a New Mexico Mountain Village, A Tale of Two Carrots

by Carol Miller November 05, 2021 Print

The other day while pulling tasty carrots out of the ground in my garden, each emerging with the aroma of the sweet earth clinging to its rootlets, I couldn’t stop thinking about the food pantry carrots. Several months ago, one of the volunteers at the Ojo Sarco Community Center Food Pantry asked if I knew the canned fruits and vegetables stored in the pantry were labeled as products of China. I am the shopper for the pantry and this information was very distressing.

Ojo Sarco, New Mexico. All photos by Carol Miller.

Ojo Sarco, New Mexico (in Rio Arriba County, a Hispanic Center), is an isolated mountain village of 300 or so people located about two-hours round trip to full-service grocery stores and most other services. This narrative is a microcosmic view of how one small community responded to the pandemic and was a role model to other communities. Over the past 18 months we have learned hard lessons about the global food system and the curse of the supply chain. We have also become aware of the policy changes needed to provide healthy food for people, no matter where they live.

Meeting Greater Demand

When the pandemic began in March 2020, the community center was very quick to implement covid-safe public health precautions. It was so early that initially there was some pushback to the precautions. But, because I have a Master in Public Health degree with specialization in occupational and environmental health, I urged the board and community to support strict safety guidelines. As it turned out, similar practices were later mandated by state and local government and voluntarily adopted by other organizations.

Immediately after the first Safer-at-Home order was issued in March 2020 by Governor Lujan-Grisham, pantry deliveries were doubled from once a month to twice a month. The number of participating households increased. Our public outreach emphasized that receiving food and essential supplies in the village and reducing the numbers of trips to town was a public health good, not charity. As a result, more people signed up for assistance. While some people pick up their boxes at the center, volunteers deliver most of the food boxes directly to homes.

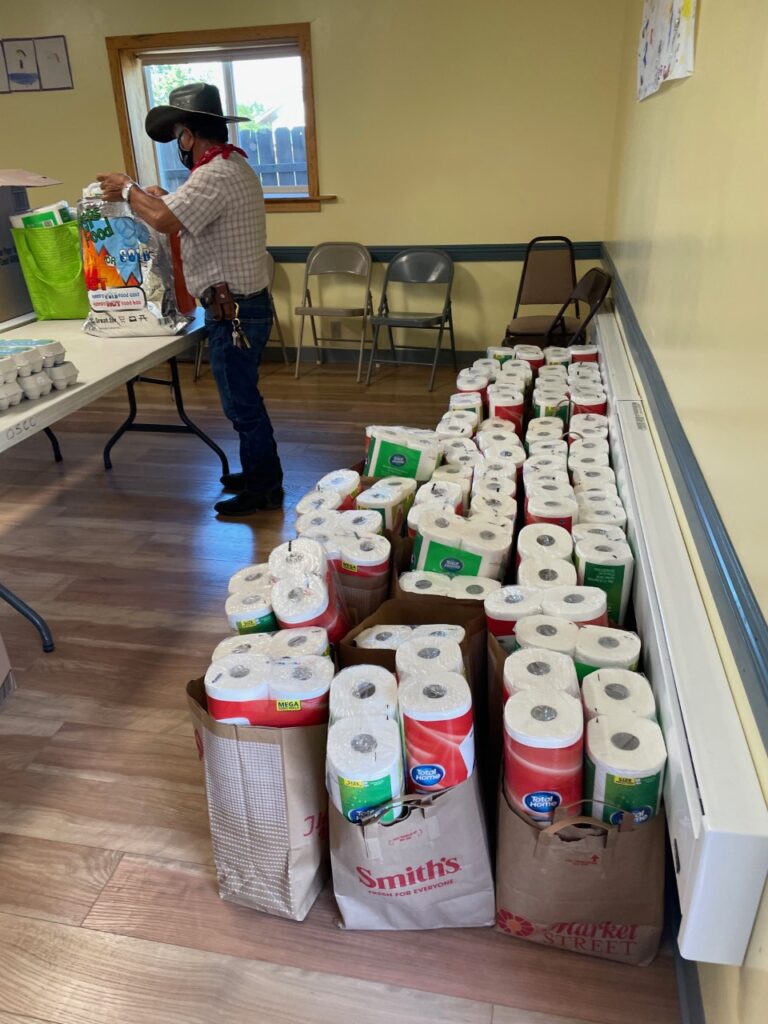
Essential supplies had never been a part of our food pantry, but literally overnight, locating items like sanitizer, face coverings, and toilet paper became very important. Tracking these items down through our existing networks and reaching out to newly emerging networks were both time consuming and expensive. Food shortages began to hit our area and meat started to be rationed as prices sky-rocketed.

In addition to being the pantry, we stepped up as a transfer site for meals to children in those early pandemic days. The school district dropped off food to the center, meals were packaged, and members of the Ojo Sarco Volunteer Fire and Rescue Department delivered them to the children’s homes. By April and May of 2020, thousands of meals each month had been distributed from our site to children. By summer vacation in June 2020, the school district had staffed up to take over the meal delivery directly from the school cafeteria.

Among several pandemic high points, the most important was the overwhelming generosity of community members, the nonprofit community, state and local government. With critical emergency funding from the federal government and generous New Mexico foundations and individual donors, safety nets were quickly woven statewide to meet the challenges.

Public WiFi Hotspot

The Ojo Sarco Community Center is one of the first public wifi hotspots established by the Kit Carson Electric Co-op. Thanks to this longstanding partnership with our electric, telecom and propane cooperative, people are able to get online from the center and from our parking lot 24/7. Usage went up during the pandemic when school, work, activities and even government went online.

Farm to Family Program

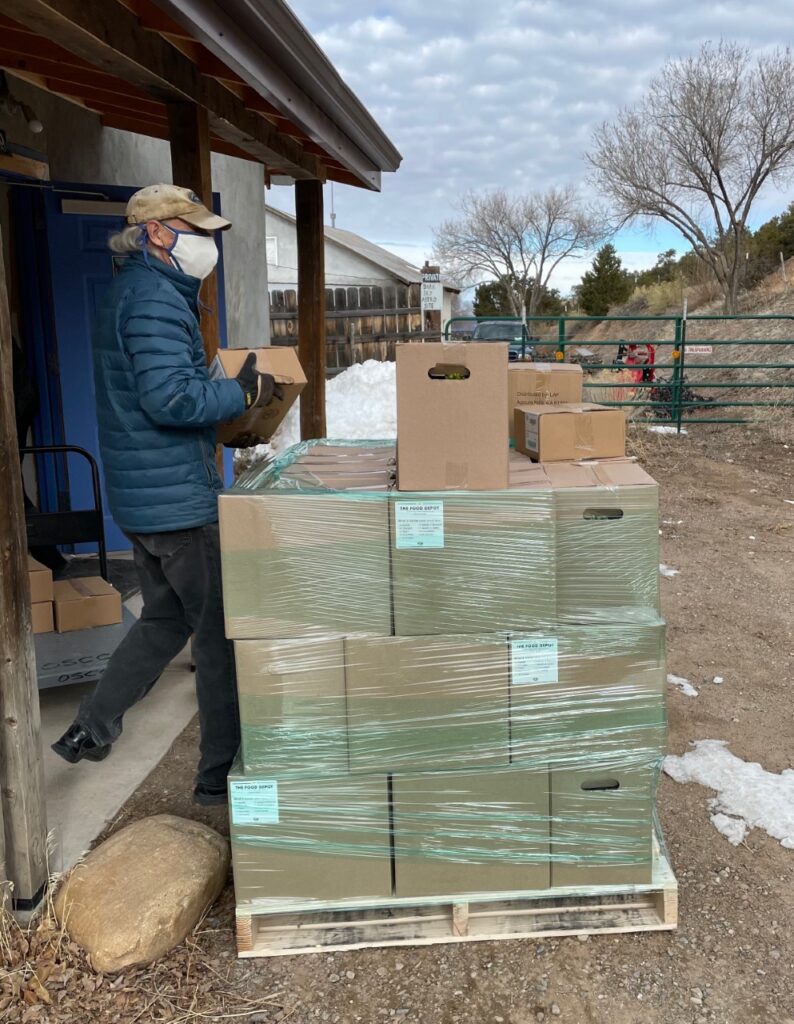
By June 2020 the food supply began to get back on track and most important to our pantry was the USDA Farm to Family program. Fresh produce had been really scarce all through March, April, and May until the fourth Wednesday in June. For the first time, we had boxes of fresh, healthy fruits and vegetables to give to every household. Later boxes sometimes had eggs, milk, bread, and other items. The pantry volunteers were excited to see pallets of these boxes delivered and so were the households that received a box or two, depending on the size of the family.

The Farm to Family program was a win-win solution to help overcome pandemic disruptions in the food supply. Disruptions included labor shortages, transportation problems, covid outbreaks at meatpacking houses, and the shutdown of restaurants. Farmers gained contracts for their produce, and it went directly to homes with needs and services providers. These Farm to Family boxes continued for close to one year.

Based on the experience of our community, permanently funding the Farm to Family program is one of our top food security policy recommendations for Congress. The food was much fresher and tastier than much of the produce received in the past. These boxes often contained fresh carrots, similar to the ones I harvest from my garden. Carrots that taste like carrots.

Ojo Sarco Meets the Global Supply Chain

On the one hand is my home-grown carrot and on the other hand are the cases of canned carrots, other vegetables, and fruits imported from China that I had unknowingly been ordering. It bothers me that the United States Department of Agriculture, nonprofit food security programs from Feeding America on down, buy or otherwise obtain, and have us distribute food from China and other distant lands. I hold to the old-fashioned idea that the purpose of the USDA is to support U.S. agriculture while assuring that people in this country have access to good food.

In the business of international trade, food is treated just like any other item, from a cheap T-shirt to a child’s plastic toy to a car. Everything is just an item on a ledger. The difference with food is the inseparable link between food and health.

Global supply chain from the Marine Traffic website.

The pandemic has taught us that the global supply chain is an unstable fiction. This photo from the Marine Traffic website on October 22 visually shows a supply chain in free fall. Thousands of ships are adrift at sea waiting their turn at backed up at ports. Even when the cargo is off-loaded, there are not enough trucks or truck drivers to move the products. The system is broken.

What does the pandemic or global trade have to do with getting a tasty carrot in Ojo Sarco? It turns out that global supply chain failures have led to more availability of tasty, fresh carrots, and other vegetables in their season. Since the pandemic hit, more people have planted home gardens whether on a windowsill, in a pot or in the yard. The early disruptions in the food supply brought on a desire in many people to reconnect with their immediate environment. Both demand and prices for locally grown food are up. When safer-at-home orders went in place, restaurants were closed and people had to cook. Baking bread even became a fad.

Here in Ojo Sarco, two high school students signed up for community service at school and chose helping me set up the garden in the spring as their project. They are the new generation with their hands in the dirt, enjoying the taste of veggies they picked themselves. I am hopeful that the food system is leaving the worst of our times behind us and moving into the best of times with access to locally grown, healthy food available to everyone.

Carol Miller is a public health and social justice activist who has been living in a frontier mountain village in northern New Mexico for 45 years. In addition to being a New Mexico community organizer, Miller has worked at every level of government; local, state, and federal all the way to the White House. Miller is dedicated to geographic democracy, the principle that social and economic justice must extend to the smallest and most isolated areas of the country. No community left behind.

Amid North Dakota’s Labor Shortage, Dispelling the Myth that “Nobody Wants to Work”

by Edgar Oliveira October 27, 2021 Print


My journey into the restaurant business began in 2009 in Linton, (pop. 937), located 60 miles south of Bismarck, North Dakota. My mother had opened a small restaurant and asked me to come help get it started. I loved it instantly. It was a fast-paced, lively environment where I could put my business school degree to work. Since then, I’ve operated two additional restaurants in Mandan, closing one in 2018 and selling another in 2019. Today, I own and operate a catering and events venue going on four years.

Of the many pieces that need to fit together to make it in the restaurant business, none is more important than labor. Within the context of the North Dakota oil boom, labor has been the most pressing challenge we have faced. In the post-pandemic environment, the market has only gotten more difficult.

Hiring and retention have been ubiquitous problems in North Dakota since at least 2010. In the post-pandemic environment, with the unemployment rate hovering around 2%, applicants are not only difficult to find but also less likely to come to interviews or stay. In the last two months, my catering company had received approximately 24 completed online applications — but no applicants showed to schedule interviews. Even with the people we have hired, we are constantly short-staffed. People are unwilling or unable to pick up weekend shifts. Around town, “Help Wanted” signs are everywhere, online job posts abound, and the shortage is the topic of conversations everywhere. Talk revolves around the tiring, unhelpful dichotomy of lazy workers vs. exploitative bosses.

When I started in 2009, kitchen staff generally made between $8.50 to $10 an hour. My first cooks were hired at $12.50. These wages continued to climb. From 2009 to 2015, cooks averaged $13 and management $20 an hour. After 2015, the pay was raised to $15 to $16.50 for cooks and $22 to $25 for managers. Today, cook pay starts at $18, with management staying at $22 to $25. All other staff are guaranteed a minimum of $15 and are tipped.

Restaurant Labor Challenges

Labor shortages have consequences. In the food business, the first casualty is food and service quality. The increase in hours and duties makes the work more stressful for those still employed. Forget being able to grow your company — what most operators dread is imminent closure.

We rely on two primary strategies to mitigate staff shortages: turning down work and increasing the scope of what employees do. There is only one other full-time worker at our company besides me, and we understand we can only do so much. In the past, we’d been able to send different crews to multiple events — this is no longer the case. As the owner, I now have to do all the cooking, shopping, dishes, and janitorial work. My pastry chef cooks and helps with dishes. My general manager makes all the bookings, delivers off-set catering, tends bar, and does venue set-up/tear-down. Even my part-time HR person cooks a little and helps organize marketing events. We’ve also pivoted to products that do not require labor. For example, we have encouraged clients renting our venue to bring in their own food.

Now, let’s not kid ourselves: restaurant work is hard, stressful, underpaid, and not something most people aspire to. It also tends to attract people who deal with issues: neglected mental health, substance abuse, aggressiveness, unstable home lives, and problems with the law. Customer nastiness is real, even more so now. Finally, the stigma of being a “burger flipper” or server is just too much for some people. America is a place that tells you to get a job, then makes fun of you for not having the right one.

Obviously, the scarcity of labor is the primary driver of the current problems. The Bismarck area has also seen an increase in restaurant openings over the last few years, further increasing the competition for talent. In our area, the Bakken oil field affected people’s conception of what a job should entail and pay. Wages increased significantly for cooks and laborers who chose to go work in the oil fields, then expected to maintain those wages when they returned. It was not uncommon for the so-called “unskilled laborer” to be making $30 to $40 in the oil field, a wage that’s not within the realm of possibility for independent restaurants.

For me, the daily grind of restaurants became unsustainable. The wages and hiring and retention problems simply could not be solved. Increasing hourly wages to livable wages — a minimum of $18 across the board in my opinion — and providing healthcare were never going to happen. I’m glad I got out before the pandemic, although I face some of the same challenges in the catering/events world.

I don’t fault people who do not want to work in restaurants and are looking for positions that provide health insurance, better hours, and better pay. I would do the same. Finally, I believe that many people realized, after being forced to take a break, that they could leave a job for other opportunities.

The Labor Shortage’s Ripple Effects

Now, labor shortages extend beyond the food business. I am vice-chair of the county social services board, and we have been experiencing shortages of licensed social workers, eligibility workers, and support staff. The shortage of social workers has led to the creation of “family specialist” positions. For these roles, the education qualification is a bachelor’s degree in social sciences. Wages start at $28 an hour with a full benefits package, but positions have been challenging to fill. The resulting burden on existing staff has pushed a number of employees to leave social services for less stressful jobs even if they incur a pay cut. Elsewhere, the Mandan Police Department is short at least 10 officers, and hospitals and clinics are still experiencing nursing shortages.

To most North Dakotans, the culprit for the labor shortage has been the government, which exacerbated the problem by “paying people to stay home”— and it did keep people home. But let me be clear: the $600 per week saved lives, property, and the mental health of many people I know, particularly those who were laid off. Both my wife and I received that stimulus, and we were out of work for months. We were extremely grateful for unemployment benefits and the PPP loans — we depended on all of it. The loans made it possible for us to keep our businesses today. While the unemployment benefits perhaps lingered too long, it’s a small price for massive programs within the context of an unprecedented emergency. I’m glad we had the help.

In my view, the pandemic twisted how people view work. After a three-to-four-month break, many people have shifted priorities toward their family and perhaps came to view “working” as less important than before. Aside from this shift, many employees have reported anxiety, less resilience, and even depression when coming back to work. I employ part-time bartenders who are also teachers, and they report that students have been much more aggressive this year. Finally, having to step on eggshells around your colleagues — because of politics and Facebook-filled views on vaccines and masks — is making work environments unbearable now. It’s a miracle anyone still shows up.

Finding the Silver Lining

Yet in this uniquely challenging time, I can’t lose sight of the miracle of having a government that was willing to pay people to stay home while a pandemic raged outside.

And even in the post-pandemic period, many people enjoy and even thrive in the restaurant environment. Some workers are resilient, don’t take things personally, are goal-oriented, and choose these jobs to make extra money, or keep busy. Many like the special camaraderie or prefer the liveliness of a restaurant to the tedium of an office job. A lot of smart, creative food service professionals and hospitality thinkers work in restaurants. We feel a great sense of accomplishment and take pride when we finish a busy night and things go well. Despite what you may have heard, things can get a lot worse than having a restaurant job. I remain an optimist.

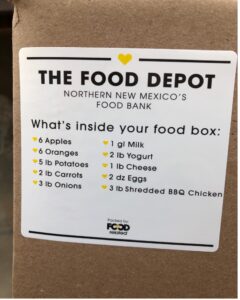
Edgar Oliveira, a resident of Mandan, North Dakota, owns a catering business in Mandan and a café at the state museum in Bismarck. He is also chairman of the board of the municipal parking authority and serves on the board of Morton County Social Services. 

Unpacking the Geography of America’s Youth Suicide Epidemic

by Dante Chinni October 22, 2021 Print

The dangers and challenges young people in the United States face are well-known. Gangs and online predators are the subject of podcasts and newsmagazines. And the continuing list of school shootings, from Columbine to Parkland, has sadly become familiar to Americans.

But for many young people, the bigger danger comes from within, in the form of self-harm. Other than unintentional injury, suicide is the leading cause of death for Americans ages 10 to 24, according to the Centers for Disease Control. In 2019, the number for suicide was higher than for homicide, influenza, and liver disease combined in that age group, according to the CDC.

And the problem has only gotten worse for young people in the United States. In the period from 2000–2004, there were 7.0 suicides per 100,000 people in the 10- to 24-year-old age group. By 2015–2019, the figure had climbed to 10.03. That’s an increase of 43%, nationally.

To understand the scale of the challenge, the American Communities Project worked with Center on Rural Innovation to analyze 20 years of suicide figures from the CDC’s WONDER database. That analysis found that suicide rates among young people had risen in every one of the ACP’s 15 community types over that time, from the densely-packed Big Cities to the sparsely-populated Aging Farmlands and everything in between. The work, funded by a grant from the Arthur Blank Family Foundation to study Deaths of Despair in America, shows just how deep the nation’s suicide epidemic goes.

Looking through the ACP’s prism of 15 community types, clear place-based patterns emerge for the suicide rates among 10- to 24-year-olds, the focus of this report.

  • Rural communities have seen some of the highest rates in suicide in the age group and some of the biggest increases since 2000.
  • The suicide rates of Native American Lands are far above all the other types, with rates more than double that of some of the other types.
  • Hispanic Centers and African American South communities have lower rates of suicide than the national average, even though many are rural.

What’s driving the increase in suicides among the young is not fully understood. One commonly cited factor is the rise of smartphones and social media sites and applications. Recent revelations about the toxic impacts of Facebook and Instagram, which is owned by Facebook, have made headlines. A former Facebook employee recently told Congress the company’s internal research found that 13.5% of teen girls said Instagram worsens suicidal thoughts, while 17% of teen girls said Instagram contributes to their eating disorders.

It’s too easy to blame social media entirely for these increases, however. Young people face a range of stressors in their daily lives, and the unsettled political and socioeconomic conditions in the United States in recent years may play a role.

More important, the data show that the community types with the highest youth suicide rates also seem to be the ones with higher rates of suicide for the general population. That is, the numbers suggest there is a place-driven component to the nation’s suicide epidemic linked to a variety of ground-level factors, including access to local mental health-care providers, general community attitudes toward mental health, and differing levels of family and community social capital.

Those place-based differences shed new light on this topic. While there can be little doubt that social media and the “virtual world” play roles in increasing suicide rates among the young (perhaps even a large role), the data in this report present an argument for the importance and power of the physical world. In short, the numbers suggest that where people live and the people with whom they interact in their communities matter a lot.

The ACP has written this piece in advance of our short documentary on teen suicide in rural Park County, Montana, a Graying America community near Bozeman. We sought to understand youth suicide in a rural community at the ground level by talking to people who have been impacted and witnessing how the community is addressing the problem. Early next year, the ACP plans to release the film, funded by the Blank Foundation and the Robert Wood Johnson Foundation. A short trailer is below.

The documentary and this report focus on 10- to 24-year-olds because the suicide increase in this age cohort is especially alarming. It’s a sign that the nation’s challenges around mental health and well-being — including Deaths of Despair from alcohol, drug overdose, and suicide — don’t just affect the nation’s aging white population. The challenges concern all races and ethnicities and even strike at the nation’s youngest populations.

This report is by no means the final word on the issue of youth suicide and geography, but should be an opening for further inquiry.

The Overall Numbers and the Spikes

The chart below shows the suicide rates per 100,000 people in the 10-to-24-year age group in all the ACP types since 2000, broken into five-year intervals. The bars show how the suicide rates in all 15 types have increased since 2000. Some types have experienced greater increases than others, but no community type has been immune.

Some spikes stand out, particularly the Evangelical Hubs, LDS Enclaves, and Native American Lands.

The Urban/Rural Divide

One noticeable trend in the data: suicide rates are highest among the ACP’s more rural communities. From 2015-2019, the seven community types with the highest rates of youth suicide were:

  1. Native American Lands (41.8 per 100,000),
  2. LDS Enclaves (17.3),
  3. Military Posts (14.4),
  4. Evangelical Hubs (13.9),
  5. Graying America (13.7),
  6. Working Class Country (13.4), and
  7. Aging Farmlands, where the rate is 22.0, but it excludes ages 10 to 14 because those data are not available due to small sample sizes.

On the other end of the spectrum, the community types with the lowest suicide rates are the most urban, the Urban Suburbs (7.9) and Big Cities (8.3).

The urban/rural differences are notable. Even excluding the Native American Lands, which are an outlier in the data (we have devoted a section to them below), the rates in the LDS Enclaves were more than twice what they were in the Big Cities and Urban Suburbs. Other rural community types are more than 60% above those urban areas.

In a sense, the higher numbers in rural America may be surprising. Rural communities are often considered tightly-knit, with strong social capital, while urban communities are described as big and impersonal. And rural communities, such as the Evangelical Hubs, LDS Enclaves, and Aging Farmlands, are places where people tend to know each other well.

However, rural places are also less likely to have easy access to mental health care. The Robert Wood Johnson Foundation’s County Health Rankings and Roadmaps shows the challenges in some communities.

  • The median Big City county has one mental health-care provider for every 320 people.
  • The median Evangelical Hub county has one for every 1,280 people.
  • The median Working Class Country county has one for every 1,300 people.
  • And there are so few mental health-care providers in the Aging Farmlands, the County Health Rankings doesn’t even measure a median.

To be clear, having more mental health-care providers in a community does not necessarily mean suicide rates are lower.

A couple of community types, the African American South and Hispanic Centers, have even fewer mental health-care providers per capita (one for every 1,310 and one for every 1,530 respectively). Both were below the national average for suicides among the young. Meanwhile, Graying America has a more mental health-care professionals per capita than other rural places, one for every 620 people, but their youth suicide rates consistently still well above the national average.

The lower numbers in the African American South and Hispanic Centers is a trend we saw in Deaths of Despair overall, as well. It may be that deeper familial or community bonds in these places help insulate them from some of the problems rural white communities face.

Why do rural communities see higher suicide rates? There are several theories.

One is isolation. Young people tend to seek out socialization and that can be harder in rural communities. Getting together with friends can be difficult when they live miles away. A related factor can be pressure to conform. On the ACP’s recent trip to Montana, people cited the pressure to fit into standard roles. For young people who are outside what’s considered the social mainstream, particularly in their sexual and gender identities, that pressure can be immense. In small schools and communities, it can be hard for those who are different to find like-minded souls.

Smartphones might actually play favorable and unfavorable roles. Young people in rural communities can use the mobile devices to connect to a much broader world, but that bigger world can also feel very distant to them.

And rural communities, often home to hunters, tend to have more guns. Firearms are the leading means of suicide in the United States.

What’s Happening in Native American Lands

The Native American Lands deserve special attention. The figures in those communities are so far above the rest of the ACP types that they don’t seem to be measuring the same data.

Overall, the figures for the Native American Lands are stark. Among 10- to 24-year-olds, more than 41 people per 100,000 took their own lives annually from 2015 to 2019. In urban areas, such as the Big Cities and Urban Suburbs, the figures look radically different for the same time period. But the figures in the Native American Lands even dwarfed numbers where the suicide among the young is bigger issue, such as LDS Enclaves, the next highest community type with a rate of 17.3 per 100,000.

And even those numbers understate the challenges in the Native American Lands. The figures among older members of the age group, those ages 20 to 24, are extremely troubling. More than 67 per 100,000 people in that age group committed suicide annually in the Native American Lands from 2015 to 2019. The next highest community type for that age group in that period was the Aging Farmlands, where the figure was 27 per 100,000.

When you see the figures for the age group on a line chart with all the other ACP types, you get a sense of the difference.

These kinds of numbers in the Native American Lands are all too familiar in the ACP’s analyses. In our Deaths of Despair work, these communities consistently sit far above the other 14 community types. The numbers serve as a reminder of the special challenges the Native American Lands face.

Many are struggling economically due to a combination of extremely rural locales with little outside investment, low median household incomes, and low college education rates. For young people, the future can look daunting. Add into the mix a lack of mental health-care providers and the issues pile up. Veteran journalist Ray Suarez examined the complex interlocking issues in the Native American Lands in Montana earlier this year.

The numbers show that the mental health challenges begin at a young age in these communities, and would seem to argue for more money and attention on early intervention. The challenges only grow as the population ages.

Communities of Color and Other Points in the Data

One consistent point in the ACP’s work on Deaths of Despair: how a few community types stand against the broader geographic trends in the data, the African American South and Hispanic Centers. Both types tend to be rural, have lower incomes, and lower college education rates. However, their Deaths of Despair figures are consistently lower than other rural communities. That trend continues with suicides among the young.

In 2015-2019, Hispanic Centers’ 8.8 suicides per 100,000 people among 10- to 24-year-olds was close to the lower numbers in the Big Cities and Urban Suburbs. The numbers in the African American South were higher at 9.2 per 100,000, but still below the national figure (10.03) and lower than the numbers in rural white communities. And, as noted above, there are relatively few mental health-care providers in these communities. In fact, the numbers are lower in these communities than in any other, except the Aging Farmlands.

The County Health Rankings shows both of these community types score fairly high for “social associations” (that’s the number of membership associations per 10,000 population). But other community types score higher, including the Aging Farmlands, where the suicide rates are higher.

Looking at several other measures (above-average childhood poverty, below-average high school completion) young people in the African American South and Hispanic Centers face steeper challenges than those living elsewhere. Yet the lower suicide numbers suggest the data are not catching everything. There seems to be a resilience built into these communities that is worthy of more study.

Two youth-oriented communities, College Towns and Military Posts, also present interesting points to study. The ACP tends to view those communities as different sides of the same coin. Both are full of younger people at a critical juncture of their lives, usually living away from home for the first time but on very different paths.

They look quite different in the suicide data for 10- to 24-year-olds. College Towns, at 9.1 suicides per 100,000 people, were below the national average in the 2015-2019 time period, while the Military Posts at 14.5 were well above it. Much is sometimes made of the stresses young people face in college — and the 9.1 figure is higher than the numbers for the Big Cities and Urban Suburbs — but compared to other community types, the College Towns' number is actually fairly low. The number for the Military Posts, however, places it just behind the LDS Enclaves as the community type with the third-highest rate.

That higher rate in the Military Posts could be tied to a variety of other factors. For instance, some soldiers face PTSD upon returning home from the battlefield. And, of course, these communities tend to have a large number of firearms, including stores selling firearms. Guns are far and away the leading means of suicide in the country. In 2019, firearms were used in just over half of all suicides, according to data from the Suicide Prevention Resource Center. The next highest means was suffocation at 29%. It stands to reason that suicides would be higher in a community where firearms are readily available.

Also of note in the urban/rural split, there are differences within urban areas. The Big Cities and Urban Suburbs were both below the national average for youth suicides in the 2015-2019 period, but the Middle Suburbs (10.7 per 100,000) and Exurbs (11.1) were above the national average for suicides among the young. Those higher numbers are somewhat surprising, particularly in the Exurbs, where families tend to have higher incomes and more comfortable lifestyles.

One possible factor is both have fewer mental health providers than their more urban counterparts, one for every 510 people in the Middle Suburbs and one for every 840 in the Exurbs. But another factor could be that those community types have higher percentages of white, non-Hispanic people, 80% in the median Exurban county and 85% in the median Middle Suburb. As mentioned above, suicide seems to be a bigger scourge in white, non-Hispanic communities.

And, in the Exurbs in particular, there may be other pressures. On a trip to Douglas County, Colorado, an Exurb outside of Denver, we heard from local residents about the pressure to “keep up with the Joneses” and try to “have it all.” We heard those stories concerning parents, but they could well be impacting younger people as well.

Conclusions and Next

Taken together, the numbers here show the size of America’s youth suicide problem and the complexities lying under it. The differences in the ACP community types are deep. Some are densely populated and some are very rural. Some are racially and ethnically diverse and others are not. Some are wealthy and others struggle with poverty. But all saw suicides among youth rise in the past two decades.

Yet the differences between the numbers in these places are a sign that easy solutions will likely not be easy to find. Rural communities in particular seem to be facing deeper challenges, but those with large communities of color have avoided the worst numbers. Access to mental health-care providers seems to be an issue, but, looking at the data, it doesn’t appear to be determinative.

It may be that the best way to understand the differences between these places is doing much deeper research and reporting on the ground. The coming ACP short documentary on Park County, Montana, will offer an example of what that kind of look can provide and explore how one community has tried to address the problem. But there is much work to be done. The numbers laid out in this report should mark a first step toward a greater understanding of a troubling and growing problem.


How Covid-Related Shutdowns and Education Level Affected Unemployment Across America’s Cities

by Becky Ofrane September 06, 2021 Print

Covid-19 has touched almost every aspect of American life over the past 18 months. In this moment, cases continue to peak and decline in seemingly endless waves, even as we inch toward economic recovery. Financial distress due to the pandemic has certainly been worse for lower wage workers, who were hit hard in the early days as the U.S. experienced a surge of job losses, with shutdowns affecting almost every industry. Learning more about who was affected most can allow communities to target recovery efforts to the most vulnerable.

Evidence shows that higher educational attainment (graduating high school or college) is associated with higher employment rates and wages, and educational attainment is also potentially an area where local governments can make a clear, tangible impact. Focusing on small and midsize cities, defined here as cities with populations of 50,000 to 500,000, we used data from the City Health Dashboard to explore unemployment rates during the initial Covid-19 wave and one year later, and how education might have been a protective factor against the impact of Covid in cities.

Spring 2020 Shutdowns and Unemployment

Between March and April 2020, unemployment increased from 4% to almost 16%, on average, across small and midsize cities. Cities associated with certain industries — like tourism and entertainment — were hit hardest by the Covid shutdowns. But this isn’t the whole picture: Educational attainment somewhat moderated that effect, meaning that cities with higher average educational attainment had a better trajectory than those with lower educational attainment. According to Dashboard data, on average, cities in which a higher percentage of the population had completed high school experienced smaller spikes in unemployment. Fishers, Indiana, for example, has a high school completion rate of 98%, and experienced an unemployment increase of 6.5 percentage points.

Exploring Covid-related Unemployment Across City Types

There is also much to be gleaned from looking at this pattern across City Types. Similar to the American Communities Project’s Community Types, which categorize all U.S. counties into 15 different types, the City Health Dashboard categorized small and midsize U.S. cities into 10 different types based on economic, employment, and demographic characteristics. These City Types allow us to explore health and equity outcomes across similar places, providing a better understanding of how social and economic conditions drive differences in health outcomes.

Most City Types reflected a similar pattern to that described above, where high school completion moderated the impact of Covid on employment. A few Types, however, demonstrated an opposing trend. Small Industrial-Legacy Cities and Latino-Predominant Enclaves, on average, had higher high school completion rates, yet large increases in unemployment. This surprising trend indicates that, in some places, educational achievement wasn’t as protective from the shocks of the pandemic and resulting shutdowns that it was in other places. For example, in Kissimmee, Florida, a Latino-Predominant Enclave primarily driven by the tourism industry and with a high school completion rate of 84%, unemployment spiked by almost 20%.


What we know about cities in these two Types provides some insight into this unexpected trend. Of the 10 City Types, Small Industrial-Legacy Cities and Latino-Predominant Enclaves have mid to high poverty rates, and the largest Black and Hispanic populations (respectively) of all cities included in our research. Historic disinvestment and bias against these specific populations of color impacts current opportunities, specifically job and advancement opportunities. Interestingly, where educational attainment was low and unemployment already high, Covid shutdowns had less of an impact on job loss — but also fewer signs of recovery a year later.

Spring 2021 and Recovery Moving Forward

Just as educational attainment was associated with lower Covid-related job loss in some places in the early days of the pandemic, on average, cities with higher educational attainment also had more job recovery in the early stages of broadscale national recovery efforts after the vaccine distribution began, around March 2021. This trend is unsurprising, as we think about which industries have been fastest to reopen and which have benefited from the ability of employees to work remotely.

As cities attempt to shift into recovery and businesses return to near-full capacity, it is critical for city leaders to consider equitable opportunities for those who may have been left behind. The United Way’s ALICE data — “Asset-Limited, Income-Constrained, Employed” — can provide additional insights into who and where these individuals live and how best to support them during recovery. Programs and policies to increase educational attainment, like child care subsidies, mentoring programs, vocational training, and others, may also benefit unemployed individuals and help get people back to work sooner.

[You can explore these programs and more from the Dashboard’s Take Action center.]

While some City Types have benefited from the protective nature of high educational attainment, the opposing pattern described above for Latino-Predominant Enclaves and Small Industrial-Legacy Cities also holds for recovery, too. For these two City Types, on average, higher educational attainment was associated with less job recovery. In these cities, the same types of programs and policies that advance education may have less of an impact on employment patterns. However, all cities can benefit from policies that raise wages and improve benefits so workers can access diversified, meaningful job opportunities and, just as importantly, support their families in doing so.

These City Health Dashboard data show that educational attainment may protect some workers from Covid-related job losses, but not all. As cities look to recover and rebuild, it’s important for policymakers to understand the unique set of circumstances of their populations to implement policies that promote equitable growth for all.

Becky Ofrane is Manager of Engagement and Partnerships for the City Health Dashboard housed at NYU School of Medicine’s Department of Population Health. Her work involves connecting with partners and city leaders to get data into the hands of those who can make a difference in health and equity. 

Special thanks to Taylor Lampe for data analysis, Dr. Yuruo Li for analysis and figures, and Shoshanna Levine and Samantha Breslin for research support.

In a Maryland Urban Suburb, Families Find Affordable Child Care Elusive

by Holly Leber Simmons August 16, 2021 Print

When Nina Perez and her husband, both 35, couldn’t find acceptable, affordable child care for their two-year-old daughter, they convinced her retired parents to move from Miami to Silver Spring, Maryland (in the Urban Suburb of Montgomery County), where the younger couple have lived for 10 years.

“I’ve been a child-care advocate for a long time,” said Perez, who works as the national campaign director at MomsRising Together & MomsRising Education Fund. “I knew how hard it was to afford child care, knew how hard it could be. The reality is the research does not prepare you for what you end up finding.”

They were aiming to spend between 7% and 13% of their household income on child care and couldn’t find an acceptable option to suit their needs.

A Proposed 7% Threshold

Under President Biden’s American Families Plan, introduced in April 2021, low- and middle-income families would pay no more than 7% of their annual income for “high quality child care” for children under 5.

“Families are currently paying as much as five times this amount,” said Erin Robinson, Campaign Manager, Early Childhood Policy at the Center for American Progress. “Right now, due to a lack of public investment in child care and the underlying financial challenges facing the industry, only 1 in 7 children who are eligible for child-care subsidies in the U.S. are receiving them.”

Making Hard Choices

The Covid-19 pandemic has been devastating for young families, defined here as families that include children ages 6 or younger.

“The child-care picture has changed, with more than four of every five centers experiencing staffing shortages and more than one in three saying they are considering leaving or shutting down this year, according to a recent NAEYC survey, so the struggles families were facing before the pandemic have now intensified,” said ZERO TO THREE Chief Policy Officer Dr. Myra Jones-Taylor.

The average weekly price of child-care centers listed on Care.com as the top nine in Silver Spring was $272. As of the 2019 U.S. Census, the median household income in Silver Spring was just under $84,000. This means the average cost of child care in Silver Spring, Maryland, is roughly 16%, more than double the intended 7% of the American Families Plan.

Despite her employer paying FMLA costs and having flexibility, Perez said it still made more sense to move her parents, Cuban immigrants who live on a fixed income, to Montgomery County, Maryland, where the cost of living is higher. “We’re asking them to pay more, there were disadvantages. It comes at a sacrifice to them. But with all the messiness it still made more sense than getting outside child care.”

Indeed, many young families have found themselves depending on help from grandparents to offset the cost of child care. This has been especially true during the pandemic for parents of young children who have been working from home, struggling to manage their jobs, their children, and their households.

Mr. and Mrs. C — he is a government appointee who spoke on condition of anonymity — learned they were pregnant with their first child, now nine months, the day after lockdowns started.

Mrs. C’s mother came to stay with them for two months when the baby was born. They hired a part-time nanny from February to April, then stayed with family out of state for two months while working remotely. They are currently spending slightly more than 10% of their household income for a thrice-weekly, full-day nanny. Both are expected to return to work full time in September, which will mean undertaking even more child-care expense.

“It would be great if the government was more lax about telework,” Mr. C said. “I’m hoping the executive branch will become more family-friendly.”

Mr. and Mrs. C are both first-generation Americans with families from India. An uncle in India died of Covid — they suspect he was infected in the hospital where he’d been admitted for another health matter. “Our families weren’t as affected as others — our families are very much middle class so they have the resources to get what they need.”

DCPS teacher Brian Hakans and his wife, an NGO supervisor, have relied heavily on her mother to help them care for their 20-month-old daughter. Still, daycare or preschool is not far off.

“I’ve started looking at the prices and I see how crazy it is,” Hakans said. “As a teacher, I think universal preschool is a social responsibility that the state should be taking care of same as any public school. I'd be for universal government daycare as well.”

Part of the reason Nina Perez’s parents are now on a fixed income is because her mother wasn't able to afford child care so she ended up leaving the workforce. “It's not just about one or the other,” Perez said. “None of these things should be barriers.”

The American Families Plan calls for “a national partnership with states to offer free, high-quality, accessible, and inclusive preschool to all three- and four-year-olds, benefitting five million children and saving the average family $13,000, when fully implemented.”

“Families with young children are currently making hard choices between the needs of their children and their family’s economic security,” said Robinson. “Congress has the opportunity to create sustained investments to build a system that supports family choice for the child care that they need, while also lowering the financial cost burden for all families, and paying early educators wages which allow them to stay in the field they love and still provide for their own families.”

In regard to Robinson's point on early educators' wages, the American Families Plan states: “All employees in participating pre-K programs and Head Start will earn at least $15 per hour, and those with comparable qualifications will receive compensation commensurate with that of kindergarten teachers.”

Trying to Meet Varied Needs

Akaynia Dixon, a retired U.S. Navy veteran, gave birth to her youngest son less than a month before Covid restrictions were implemented.

Dixon, a single mother who also has two teenage children, including one who has special needs and attends private school, has not been able to find an affordable daycare option in Silver Spring that accords with her child-led parenting philosophy. She has started looking in Virginia, which would require more than an hour of commuting each day.

A major issue with child care is not just having choices but having meaningful choices. “On paper, there are going to be tons of choices,” Perez said, “but if what you can afford doesn’t meet your child’s needs, that’s not an option.”

For her family, who speak Spanish at home, a program with a Spanish language program was necessary. For many Black parents, having representative providers is essential.

“I've had people say, ‘Well, why have kids? I should be able to have a child in this country without worrying that we're going to go into debt,’” Perez said.

Holly Leber Simmons is the founder and principal of Red Pen Editorial Services, and is a former newspaper reporter. She lives in Silver Spring, Maryland, with her husband and daughter.