Editor’s note: The American Communities Project asked a few community leaders around the country to share their hopes and what their community most needs from the new Biden administration.
I am City Administrator for America’s Seaplane City, Tavares, in central Florida’s Lake County (part of Graying America in the American Communities Project). Here I manage a full-service city of 18,000 people with 200 employees and an annual budget of $55 million. As I consider my city’s needs and my hopes for the newly inaugurated Biden administration, I offer my own opinion here, not that of the City or its elected body.
Addressing Needs
As the administration gets underway, I think our most pressing need is to obtain financial assistance for existing infrastructure. I’m not sure we need more or newer infrastructure as much as we need to maintain our aging infrastructure.
In general, what cities need are more grant programs to repave streets, fund public safety, police departments, fire departments, and Emergency Medical Services as well as maintain trails and parks and local economic development programs. Currently, the federal and state governments will only fund new infrastructure, then dump the maintenance of infrastructure on the backs of local governments that cannot afford it. What local governments need are more infrastructure maintenance grants and programs than new construction grants. Implemented strategically, those maintenance grants could incorporate “unification” conditions that the federal grant agency places on the community that further the federal government’s priorities. For example, if the federal government believes each city should have an accredited police department, it could make that a condition of receiving the infrastructure maintenance grant. This grant assurance would continue long after constructing the capital item.
To that end, I recommend that the Biden administration reverse the entire federal formula. Instead of providing a grant to build a capital item that the local government agrees to maintain, the local government ought to build the capital item through local taxation and low-interest governmental infrastructure loans.
Then, the federal government ought to agree to assist with the maintenance of the infrastructure tied to a “unification” grant assurance. (A unification grant assurance is a requirement the federal government puts on the local government, supporting a unified position across America at a local level that the federal government wants implemented. It continues as long as the local government desires to receive that annual federal maintenance contributory grant. An example of a unified position: that all local police departments across America should be accredited.) Either providing annual payments or establishing a local trust fund for continued maintenance of that infrastructure would suffice.
Such a move would reduce the federal government’s financial burden for large capital expenditures on local projects, while reducing local governments’ annual burden of maintaining and operating their infrastructure, while implementing a unified position across America on a local level — a win/win/win.
Realizing a Vision
In that spirit of mutuality, I’d like to see the new Biden Administration lead and unify the nation by lowering the volume and influence of the relatively small number of extremists and raising up the voices and influence of levelheaded, rational Americans.
Then, it must focus on implementing this vision — because a vision without implementation is a hallucination. The work of the federal government and this new administration gains its authority from America’s founding fathers, who had a clear vision of how government should work. The federal government was to be dependent on the states. As James Madison wrote: “Each of the principal branches of the federal government will owe its existence more or less to the favor of the State governments, and must consequently feel a dependence.” The Tenth Amendment of the Constitution stresses this point, stating: “The powers not delegated to the United States by the Constitution, nor prohibited by it to the states, are reserved to the states respectively, or to the people.”
In this structure of federalism, the expression “all politics are local” rings true every day. Citizens reach city government first because the city is the closest to the people. If the new administration wants to have an immediate impact on Americans, I’d recommend using two existing channels: local policymakers and local implementers.
Local policymakers (city councilors) are represented by the National and State League of Cities.
Local implementers (professional city managers/administrators) are represented by the International City/County Management Association (ICMA), and in Florida the Florida City/County Management Association.
If the administration wants to immediately implement a vision and communicate that vision to Americans, it could, in theory, make one phone call to ICMA’s Executive Director Marc Ott to get the ball rolling, and the message would get to every professional city and county manager in the U.S.
If the administration wants to immediately implement a policy and communicate to every local policymaker in the U.S., it could make one call to the National League of Cities Executive Director Clarence Anthony. The message would, in theory, get to every local elected official in the United States and to every American via their elected local official and trusted city manager.
To be fair, not every city or county elected official belongs to these two associations. However, most do belong to them as well as their affiliate state associations. Both associations have enumerated ethical standards for membership and sanctions for violating these standards — the embodiment of rationality and levelheadedness. I think this underused pipeline to local communities should be used more by the new administration, given new video conferencing technology like Zoom.
In my humble opinion, delivering a message, policy, or action via local and levelheaded Americans will produce the best results.
Editor’s note: The American Communities Project asked a few community leaders around the country to share their hopes and what their community most needs from the new Biden administration.
In this past year, I have seen so many fall down, fall ill, and tumble into despair over a pandemic that has infected every aspect of our community. I see people in our food lines for the first time in their lives. I see the desperation and sadness in their eyes, mothers and fathers who are having to work, to teach their children at home, and to figure out how to survive with so many disparate messages.
It is the culmination of four years of hate, selfishness, anger, and neighbors pitted against each other. Family members and friends no longer talking to each other. Justice lost, humanity waning, and a “me first” attitude that hurts us all so deeply.
I feel as though I am coming out of a very deep sleep, a winter of discontent that lasted four years. My heart is soaring as I watch the inauguration ceremony. My hopes are reawakened in a land of free and brave, in the possibility of achieving the impossible, the determination that all shall be included in this country that I love so much.
Our new President said: “To overcome these challenges — to restore the soul and to secure the future of America — requires more than words. It requires that most elusive of things in a democracy: Unity.”
This is the America that I dream of, that I love. This hopefulness, this inclusion, this “we can do anything if we work together” is the America that I work for. I have always believed we are only destroyed from within. To unite with each other we must respect our differences, embrace our uniqueness, and celebrate each other’s accomplishments. Americans roll up their sleeves and work together. Americans care about the rest of the world. We are not really “me first” but “how can I help?”
This is what led me to work in the nonprofit world, where my deepest beliefs are demonstrated in the work of my hands and heart. Where I can make a difference. To me, the Biden-Harris team represents the absolute opposite of the last four years. The spirit of their inauguration takes us back to a home in our hearts, a place where our children can feel proud of us and we can mend fences.
This dawn of a new day makes me not even want to reflect on the past, not mention my concerns about us forgetting what we have survived and not making the changes we need to make. The excitement of a government that looks like its people, that places honesty and freedom of the press at the top of their list, makes me want to believe in this impossible dream with all my heart.
I am so grateful to all who fought to make this a free and fair election, to all who stood by their principles the past four years despite the pull to the dark side. Thank you, Joe Biden and Kamala Harris, for taking the weight of our world on your shoulders and showing us the light at the end of the tunnel. I promise to keep my light turned on.
Annie Ansell is Executive Director of Dysart Community Center in El Mirage, Arizona. The organization provides educational and developmental opportunities for low-income children and adults in the Northwest Valley of Phoenix.
Editor’s note: The American Communities Project asked a few community leaders around the country to share their hopes and what their community most needs from the new Biden administration.
President Joe Biden has promised to be a president for all Americans. He has said this is a time to heal in America. Kent County welcomes this.
As Kent County’s Administrator, I yearn to regain peace and hope after glaring racial inequities have opened wounds and stirred unrest. I long for healing and strength as we emerge from a pandemic that has decimated the health of our people and the vitality our local economy. But when political divisions still run deep, social inequities still plague our cities and towns, and hospitals are still filled with the sick and dying, what do healing and unity look like at a community level?
To heal and unify, we must regain trust. Trust is the currency of democracy and the working capital of innovative governments. To regain trust, we must first understand that unity does not mean homogeny. We will always have differences, particularly the farther we go from our own front door.
Washington, D.C. is a long way from the doorstep of Kent County (pop. 656,955), classified as an Urban Suburb in the American Communities Project. Federal, state, and local officials do not always see eye-to-eye on how to serve the people effectively and efficiently in local communities. Instead of criticism and suspicion, we seek trust and leadership. In my opinion, those have been in short supply of late.
What’s Eroded Trust
As federal lawmakers debated the latest Covid-19 relief package, their narrative about state and local governments was false and destructive. Claims of self-dealing, ineptitude, and inefficiency were demoralizing and frustrating for public health officials on the front lines of the pandemic, for police officers and first responders who put their lives on the line each day, for social service providers charged with retooling programs for people whose health and economic well-being were in peril, and for administrators and many elected officials who had to navigate the changing circumstances and lead through unprecedented uncertainty.
State and local government officials are those most directly responsible for the well-being of our communities and our residents. We are on the ground delivering essential services. We are the face of public safety. We are the voices who speak from the doorstep to calm local unrest and ease uncertainty. The delays and funding inadequacies that resulted from the congressional debate were shortsighted and put communities in Kent County on the brink of disaster. The shortfalls eroded trust, not only between local and federal government officials, but between the government and our people. This must not continue. People are hurting — mentally, physically, and economically. We need leaders in Washington who will stand with us to address their trauma.
Why Localities Need Covid Aid
I humbly call upon President Biden and the new Congress to immediately remedy the biggest oversight in the recently passed Covid-19 stimulus relief package. While the relief included many vitally important provisions, it omitted direct and flexible aid for counties and other local units of government. This aid would enable Kent County, for instance, to assist many of the 380,500 Michigan residents who have lost their jobs, and many who have lost or are at risk of losing their homes.
It’s also vital for the administration to develop and fund a cohesive, comprehensive plan for vaccine distribution — one that maximizes efficiencies while targeting high-risk and underserved populations. This effort should also work to improve testing capabilities and contact tracing in high-risk minority communities in both urban and rural areas.
Prioritize Small Business Support
Kent County’s small businesses are hurting, too. Michigan has taken an aggressive approach to combat the spread of the virus. That has included months-long shutdowns for many businesses — including bars and restaurants, which are due to reopen, only on a limited basis, on February 1 after being closed to indoor service since November 18, 2020. While it’s impossible to determine the exact scope of the impact, many small businesses in Kent County will permanently close their doors without additional meaningful support.
Our new administration should help mitigate these losses and continue the work that Congress began with the Paycheck Protection Program and other small business support. I was encouraged by set asides in the recent stimulus bill that will help ensure that minority businesses are not left out, and I support additional funding for the Minority Business Development Centers program under the Minority Business Development Agency.
I further urge the Biden administration to support assistance for community lenders, including Community Development Financial Institutions (CDFIs), Minority Depository Institutions (MDIs), Certified Development Companies (CDCs), and microloan intermediaries. Investments made today in small business recovery will pay big dividends in the long-term health of our economy and our communities.
I affirm the Biden administration’s calls for unity and healing. Those calls must be met with trust and leadership. We stand ready to offer both.
If someone wanted to design a place where the underlying causes of the nation’s Deaths of Despair epidemic were built into culture and geography, it might look a lot like Montana. The state’s staggering beauty contrasts sharply with the many challenges it faces around suicide, alcoholism and drug use.
In the U.S., people are more likely to die by their own hand in sparsely populated areas, and Montana has one of the lowest population densities of the 50 states. In a country where veterans, older men and gun-owning households are at higher risk, Montana has more of all three than the average American state. It treasures rugged individualism in a time when loneliness is commonly reported as a mental health problem. In a world where more suicides and attempted suicides occur at higher altitude, it sits on America’s Rocky Mountain spine. While it is well-known that effective treatment and follow-up for depression requires access to mental health professionals, Montana struggles to recruit and attract psychologists, psychiatrists and social workers. Montana has had one of the highest rates of suicide in the country for a century and bounces, depending on the years, between the top and slightly trailing positions in America’s rankings.
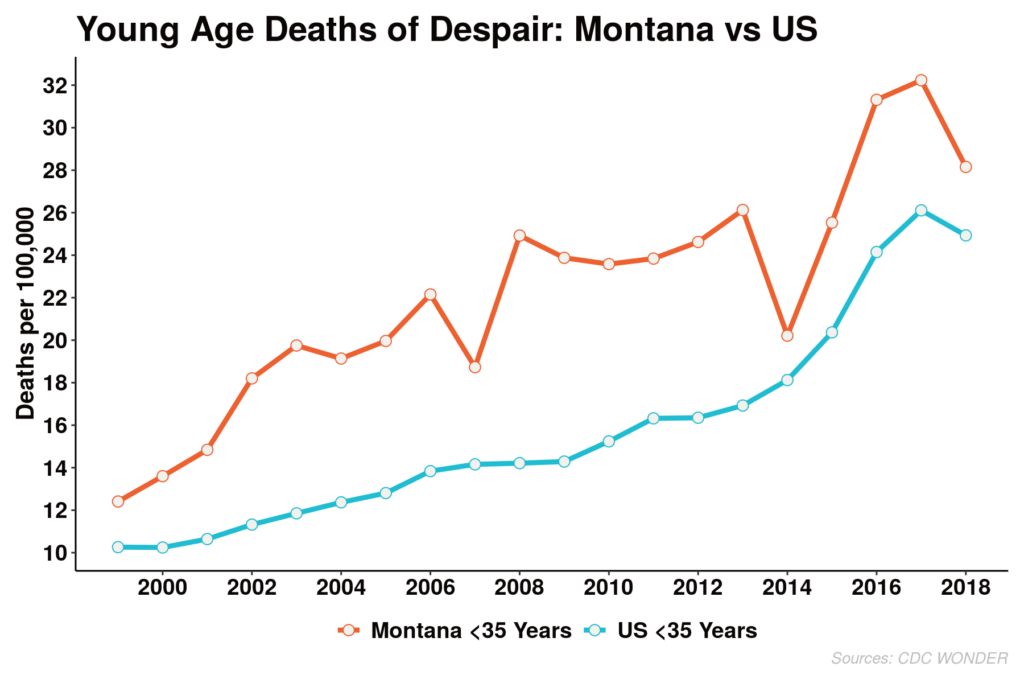
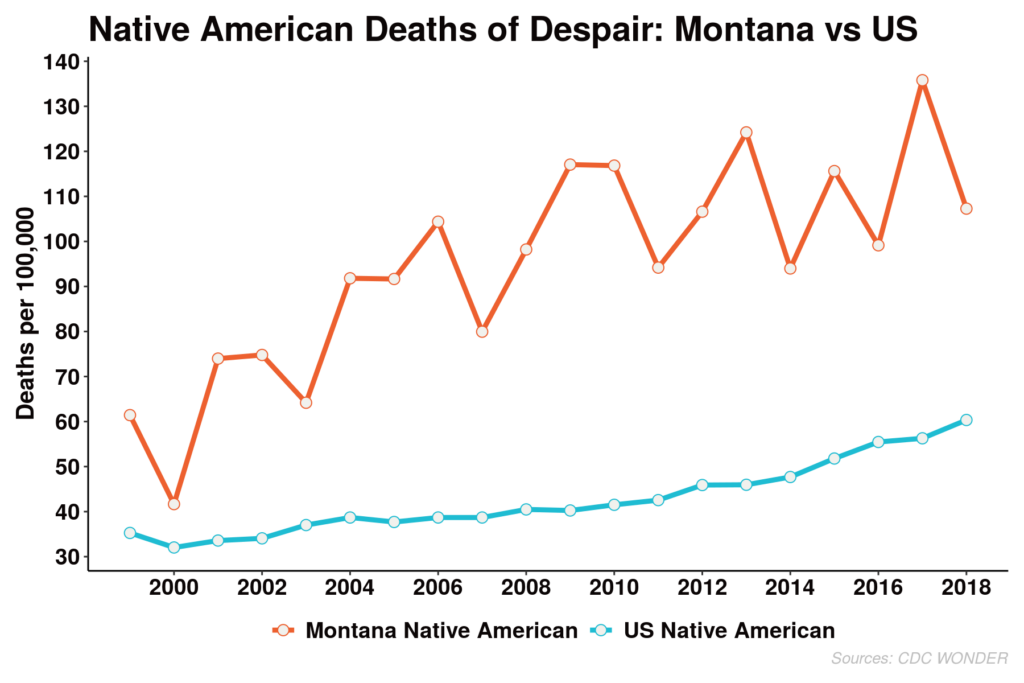
And so, as the United States saw a strong and steady upward trend in deaths linked to suicide, alcohol and drugs, Montana moved up in tandem with other states. History and geography, however, give the problems that lead to early death a particular, and particularly challenging, profile. Montana is seeing rising numbers of deaths among young people, and it’s seeing that trend among enrolled residents of the native tribes that call Montana home.
The Montana Landscape
This piece is the second in a continuing series of reports on Deaths of Despair across the nation by the American Communities Project funded by the Arthur Blank Family Foundation. Our first report, in July, laid out the size and impact of the problem across our 15 county types. Data analysis and visualization are provided by the Center on Rural Innovation.
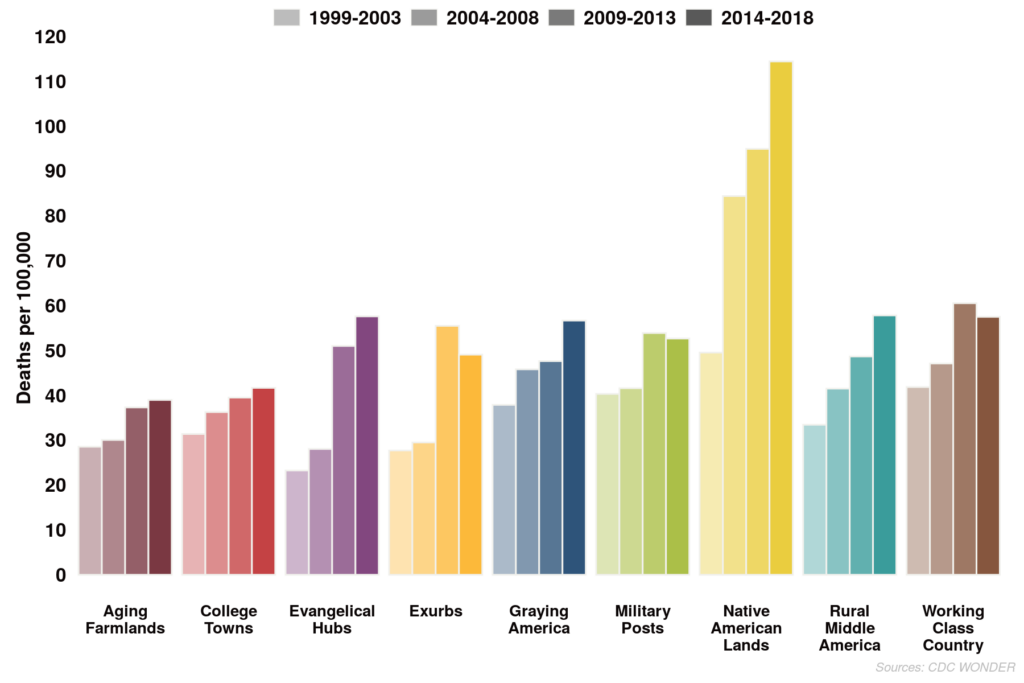
The state is not very diverse. The Census Bureau puts the white population at about 86% and the Native American population at roughly 7%, meaning Asian and Pacific Islander, Black, Latino, and mixed-race populations only make up about 4% of the state’s people. The trip from the western border with Idaho to the eastern border with North and South Dakota, at about 750 miles, is longer than the trip from Washington, D.C., to Chicago, which would take you through five or six states. And even if Montana is not known for racial diversity, it holds a wide range of different community types. Within those far-reaching borders are counties classified using the American Communities Project matrix as Aging Farmlands, Working Class Country, Rural Middle America, College Towns, Evangelical Hubs, Exurbs, and Military Posts. With just a few exceptions, these various community types have seen significant run-ups in the numbers of deaths from alcohol and drug abuse and suicide.
Clustered on the eastern end of the state, the Aging Farmlands have seen a gradual rise in the deaths of despair. And on the western border, the counties that make up Montana’s Working Class Country have seen significant rises in all classes of early deaths.
Deaths of Despair by Year Groups [Colored by ACP Types]
A Long List of Challenges
I meet the state’s suicide prevention coordinator, Karl Rosston, as he is about to begin a training program for nurses on warning signs for people contemplating ending their own lives. “We’ve been in the top five for the last 40 years. As a matter of fact, we’ve been near the top since we started keeping data in 1918.”
At a cafeteria table at Montana State University in Bozeman, he describes a daunting set of variables, some of which have a solution, many of which don’t. “We’re a northern state. We have vitamin D deficiencies because we have less sunshine. And Vitamin D deficiencies are correlated with higher risk for depression.”
The opioid overdose problem that has been ending tens of thousands of lives in America for years is present in Montana, but not a leading factor in early death. Rosston noted that in 42% of his state’s suicides, alcohol was found in the body, the rates for opioids and other drugs are much lower. “I see a lot of people who use alcohol to self-medicate their depression or anxiety. There’s one problem with that, alcohol is a depressant. Using a depressant to medicate your depression is not going to work too well.
“We’re near the top in the nation in alcohol consumption per capita, in alcohol-related deaths and DUI. And then you throw in access to lethal means,” which, in Montana means firearms that are easy to acquire in the state, “and you have a really major issue. Because bottom line: Nationally between 70 and 90% of suicide attempts are by overdose, but it’s one of the least lethal means, anywhere between 3 and 11%. But when you use a firearm it’s more like 90%. Nationally about 51% of all suicides are by firearm, in Montana it’s about 63%.”
Isolation is a problem. Simply put, at 147,000 square miles, but just a little more than 1 million people, much of the state is empty, or close to it, at a population density of just 6.7 people per square mile. It has about the same population as Rhode Island in an area about 95 times the size. Isolation is bad for depression, and vast distances make for practical challenges, said Rosston. “At the law enforcement academy, they tell me it can take an hour and a half to two hours to respond to a 911 call.”
Yellowstone County, just outside of Billings. Montana’s population density is under seven people per square mile. Photo by Ray Suarez
When I asked Rosston, who reviews the death certificate of every suicide in the state, to give me a recent, typical case, he said, “You have a 40-year-old male, who has had a recent divorce. May have quit his job or is not working, chronic pain. Uses a firearm. Recent history of increased drinking. That’s the profile I see all the time. The relationship component is huge, as is the firearm.”
However, the disturbing growth Rosston sees in the numbers are not among the middle-aged white men, the military veterans or the chronic pain sufferers who have long buttressed Montana’s deaths of despair figures. Rather, he sees worrying signs among young people, and especially Native Americans, both in urban areas and on tribal lands.
Every state in the union contributes data to the national Youth Risk Behavior Survey. Montana’s 2019 numbers are sobering reading for anyone trying to understand the rise in deaths of despair. More than a third of the state’s teens say they felt so sad or hopeless for two weeks or more in a row during the previous year they stopped going to school. More than a quarter thought about suicide, and for about one out of five, it was serious enough to contemplate a plan for ending their lives. One in 10 had actually attempted to end their life. In contemplating, planning and attempting suicide, the rates for girls exceeded that for boys. Almost a quarter of high school girls, 23.5%, reported making a plan to end their lives, a rate roughly twice as high as that for high school boys at 12%. Some 12% of girls reported they had attempted suicide, a rate about 50% higher than that reported by high school boys. For boys and girls, the rates of all these suicide-related behaviors exceeded the national average. Among their Native American peers, the attempted suicide rate was almost twice as high.
The numbers are no surprise to Christina Powell, co-director of Bozeman Help Center, a crisis hotline. “If there’s a common thread, it’s the ability to tolerate loss. And when I say loss, I’m talking about everything. From things like, you know, a girlfriend or a boyfriend. Loss can be everything: loss of job, loss of status, relationships, loss of family. Loss is in some ways perceptual, in many ways concrete. All human beings experience a level of loss throughout a lifetime. That’s to be expected. Loss seems to be consistently there in moments of despair.”
THE CRISES FACING NATIVE AMERICAN YOUTH
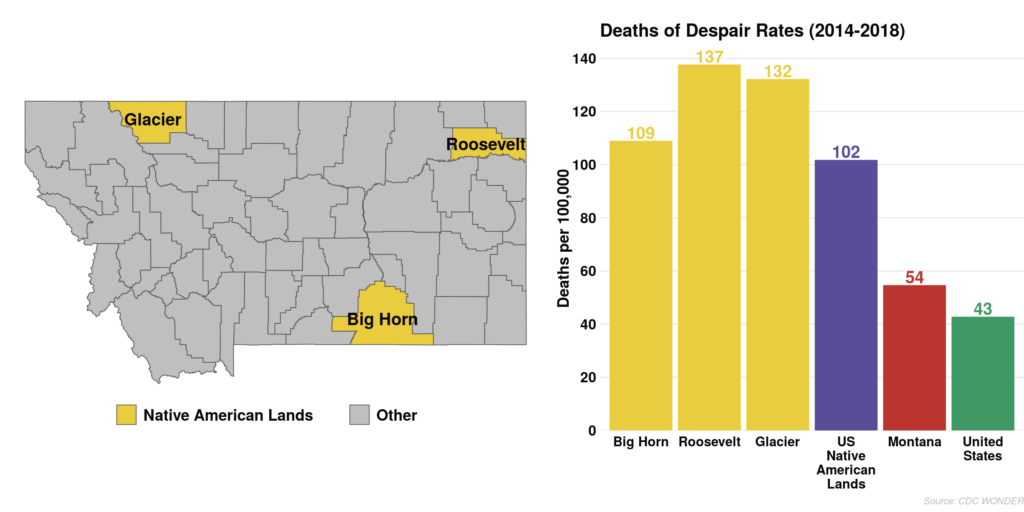
The Deaths of Despair numbers are particularly concerning in the Native American Lands county type in the ACP. Our first report noted how the rate in the Native American Lands of 101.6 per 100,000 people, was nearly three times the national rate of 38.3. And several Native American Lands counties in Montana (Big Horn, Roosevelt and Glacier) sit above the national figure for Native American counties. The roots of those high numbers are deeply tied to larger historical and cultural challenges in the Native American Lands counties.
Educator, activist and Crow tribal member Shane Doyle sees despair on the reservations, and says it makes sense, given what teenagers are up against. The Crow Reservation is mostly in Big Horn County. “Look at what has occurred here over the last 150 years. If you’re a kid, you think it’s normal to live in utter poverty. You think it’s normal to face a cascade of health issues. Unless you can see your way through to the issues of how we got here, you’re going to be weighed down by fatalism.
“If you can’t describe how Native people were once proud and strong and healthy and resilient, if you can’t conjure that up in your mind, it’s going to lead you to believe either Native people deserve this, or are stupid, or lazy. Or you believe the myths, we can’t handle alcohol, or how you don’t fit into society. Myths made popular by books and media and movies.
“If you decide you don’t want to accept it, what options do you have?”
Speaking to tribal members and other Montanans, on the reservations and off, a phrase kept popping up in interviews: “historical trauma.” It can’t be measured by researchers, it can’t be tracked from year to year, or compared in state-by-state tables. For adults trying to head off the suffering and early death so common in Indian families, that trauma is as real and tangible as statistics about high school completion or drug possession.
“Think about what it’s meant to experience generations of catastrophic and cataclysmic loss,” Doyle said. “The whole process started with smallpox, diphtheria, typhoid, diseases brought here from outside. That was just the beginning of hard times for Native people here. Most of them lost at least 75% of their communities, then land stripped away.”
Along with poverty and physical suffering came cultural eradication, with children moved off tribal lands and away from families to boarding schools, not once, but for generations of children, an intentional stripping away of ancient languages and cultural knowledge. Doyle said, “It’s a community that’s been traumatized for well over 150 years, and hasn’t been able to regain its independence.”
The land is stunning. Jagged mountains emerge from golden grasslands. Threads of cloud crisscross the renowned sky. Suddenly curious cows raise their heads in unison to watch a single car come by on a gravel road. All that breathtaking beauty can’t hide the worn mobile homes, the sparse store shelves, the cracked windows mended with masking tape to hold the powerful wind rippling the roadside brush.
Confronting the Problems
Alma Knows His Gun McCormick is the executive director of Messengers for Health, a program on the Crow Reservation bringing education, advocacy and health services to tribal members. While identifying the need for better healthcare on the reservation as an important issue in fighting deaths of despair, McCormick does assign a role to historical trauma, as well. The role of rejection in the history of her Crow people and other Montana tribes is underestimated, and it binds her people to this day. “We see the natural events, boarding school, broken treaties, racism,” she said. We can describe those facts, but underlying all of it, it’s a spiritual thing … it’s rejection. Because of being displaced, having our lands taken away, assimilating to a culture different from ours, we experience a spiritual rejection.”
McCormick connects her people to essential health services and the latest diagnostic procedures, and at the same time assesses something harder to see, “a heaviness” that keeps her people in its strong grip. “That identity, those values, that’s what has kept us over the years, facing adversities of historical trauma. That is how we have overcome.”
McCormick said the Indian Health Service, an arm of the federal government, makes mental health treatment available for tribal members, but stigma makes even those in deep trouble shy away. “They don’t seek it out. Confidentiality is key and, unfortunately, that’s one of the barriers that keeps people from going to Indian Health Services, lack of confidentiality. And not only in the area of mental health, just going and receiving healthcare.”
In small communities like Crow Agency, it is well-understood that people have mental health and drug counseling needs, McCormick said, but there is little confidence that a family’s private matters would stay private. “Information seems to leak out. Everyone knows everyone. If they went to an appointment, maybe they were diagnosed with something, or if some things going on, information goes out.”
If they try to go elsewhere, it can mean a long drive. “People have to go into Billings if they want to see a specialist. It’s a hundred miles round trip, and transportation can be a significant barrier to people seeking healthcare.” During the COVID emergency, burning through Montana through the autumn and into the winter, McCormick was able to use pandemic relief funds from the state to issue $30 gas cards, which allows a reservation family to make the long trip to the state’s biggest city. Some communities on reservation land are much farther away, and get a $40 card to cover the gas.
As a licensed clinical social worker, and a man immersed in data from his state and around the country, Karl Rosston easily rattles off the numbers that define his state’s challenges from untreated pain to distance to the nearest psychiatrist.
He also cites both historical trauma and an alienation from the tribal past as big factors in suicide rates on the reservations, about twice the national average. “Where we often see a huge gap is between the youth of the tribes and the elders. The elders, one of their main jobs, is to pass down the traditions of the tribe. We see a huge gap where these kids are not learning their culture, not learning their language, not learning their healing ceremonies, and you have a generation of lost kids. Then they’re exposed to poverty and addiction and crime and gambling and everything else evident on our reservations, and you can understand why you have such a high rate of despair, and suicide.”
Underlying Issues
The pain of too-early death is present across the Native American Lands counties of Montana. There is a strong desire for change, and there’s an acknowledgement that high levels of family dissolution, substance abuse and joblessness cannot be changed overnight. Lack of daylight and altitude that reduces the effectiveness of anti-depressants are impossible to change. Tribal members wrestle with the long- and short-term nature of their challenges and try to find near-term solutions that save lives, while still wishing to tackle the big, structural problems.
Peggy White Well Known Buffalo said she saw problems everywhere she looked on Crow lands: drug abuse, alcoholism, domestic violence and threats to the maintenance of the language and the tribe’s traditions. With her Center Pole project, she tried to pick off those problems one by one, providing a cultural hub, a source of nourishing food, and training in Crow arts and traditions. We talked in the Center Pole’s café as she gave instructions and greetings in Crow to workers and volunteers bustling in and out.
White said a vision during a traditional sun dance pointed the way. In her vision, she walked past tables full of food and saw an Indian man who told her to “feed the ones that need it. Give it to people who don’t have.” Switching back and forth between English and Crow in the story, she recalled, “I know what it is not to have food. I can remember not having enough to eat.”
Reluctant to use the term “mental illness,” White recalled her own grandson’s death, just weeks before. In a video addressing White, her grandson apologized for ending his life and forced her to look back in regret, and wonder why she had not done more to pull the young man into her orbit. “Why didn’t I check on him when I didn’t see him for six months. Why didn’t I try to guide him in my spiritual beliefs? Why didn’t I try to spend more time with him? It was really hard.”
White works with recovering alcoholics and drug users, as well as children and adults who have suffered domestic abuse. Lightening the burden of historical trauma, White said, requires an approach to Native people that preserves the best of their past to bring healing and balance to the present. She takes young people to Crow holy places, teaches them the use of native plants for religious customs and herbal remedies for medicine.
Young Tribal Members
McCormick is committed to getting her people treatment, and she wants to find an approach that incorporates a heavy influence of Crow traditional teaching into a community health model to combat substance abuse and early death. “We are designing it right now. We’re researching intervention on how to improve self-care when people have chronic illness. It shows very strongly our people need mental and emotional wellness support. We set up a support group with our cultural ways, our language, our kinship, our wisdom passed down.”
Collena Brown grew up in the tiny town of Grass Lodge and has lived there almost her entire life. She watched as the local Boys and Girls Club, run by the tribe, lost its charter and went belly-up. Though her family was preparing to leave town for new work, Brown instead revived the charter, and is running her new club separately from the tribal administration. “We started everything from the ground up, from finding board members, finding funding. I had never written grant applications in my entire life.”
The new Boys and Girls club was finding its feet just as the Crow reservation grappled with the coronavirus pandemic, and school-age children were sent home to learn remotely, with very little support or follow-up for remote, self-guided learning. Toward the end of the year the schools remained closed. Brown is trying to keep kids current with their studies while supporting parents who must work. “The kids know that we’re there, that we’re here to help them.” The Boys and Girls Club is hiring high schoolers as tutors, and raising up leaders at the same time. “We’re teaching them the joys of having a job. The responsibility of looking after themselves. We don’t take calls from parents. If you can’t make your scheduled shift, you have to call.
“We’re making sure the teenagers know what responsibilities they have.”
She worries about the threat of early death, the kids she can’t reach in time, and what to do about their memories. “We almost glorify the ones who had committed suicide. We have to remember them, but I don’t think we should make it bigger than it is, so that the youth see it in a good light.”
Brown said she sees teenagers who are nearly on their own, with loose association to broken families, and homes far removed from other connections. “They have no relationship with their parents. No support whatsoever. A kid is looking for a safe place, somebody who will listen to them. In town, it’s a little different, maybe you have to be a little careful where you go. But farther out? A lot of them are stuck out there.”
Overcoming Isolation and Finding Meaning
That isolation, that lack of connection, is dangerous for people in crisis whether they find themselves miles from the nearest town on the Crow lands, on a farm first planted by European ancestors at the turn of the last century, or in one of Montana’s small cities. Kathy Allen trains the crisis counselors who work the phones at the Bozeman Health Center, and said the combination of shame and isolation leads people to crises they conclude they cannot share with the people around them. So they end up on the phone. “Part of our job is to reduce that shame, validate that the person is in pain, that of course these thoughts are coming up for them.
“I talk to a lot of teenagers who feel shame about reaching out. In Montana, there’s a mentality around not needing help, being able to get through things on your own.”
Resilience, and the lack of it, was identified as a culprit on reservations and off, among people of all races and ages. “It’s not just money,” said Shane Doyle. “You can’t just give a kid money and say, ‘Now go and be happy.’ There are a lot of angry young men here in Montana. And they’re angry because they haven’t been able to connect and express their humanity.”
Karl Rosston wants to screen for depression among every child in the state by the age of 15, a common age of onset, to get help early to someone who might otherwise endure decades of suffering that ends in early death. He is training nurses around the state to look for the behavioral clues to someone more likely to die a death of despair. “The more tools they have, the better they’re going to be able to recognize and identify these people that are at risk.”
Christina Powell wonders about what has changed in society. She knows there are a lot of walking wounded among us, and at the same time wonders if it is the challenge of daily life that has changed, or us? “What is our ability to tolerate loss? Is it being degraded as time goes by? Is there an increase in the experience of loss? That’s hard for me to believe.
“Are we adequately preparing our children to face loss?”
Shane Doyle said we never ask the most obvious question: “What does it mean to have a high quality of life? Our education system has been built to produce workers.
“How about happy human beings?”
Ray Suarez is co-host of the public radio program and podcast World Affairs, and covers Washington for Euronews. He is the author of three books on American life, most recently Latino Americans: The 500-Year Legacy That Shaped a Nation.
There’s a long list of measures that examine who is struggling in the United States — from poverty rates to income inequality — but in recent years a complicated set of personal struggles and challenges has come to be measured in one phrase, Deaths of Despair. This phrase describes deaths caused or brought on by alcohol and drugs as well as suicide. Behind the three words is a long list of root causes.
With this piece, the American Communities Project begins a two-year exploration into the causes and effects of Deaths of Despair, as well as positive interventions that might help decrease the phenomenon, funded by The Arthur M. Blank Family Foundation.
We’ll explore the term through the ACP’s 15 community types and analyze what drives the differences in deaths by community. The data raise many questions, including:
Why do some types of community seem to struggle with high numbers of Deaths of Despair and others do not?
How much of a factor is the racial composition or median age of a community, or the economic situation on the ground?
How do some communities overcome their challenges?
This effort will also explore the impact of the Covid-19 pandemic on Deaths of Despair in the United States. The Well Being Trust has already written that the pandemic could lead to an additional 75,000 deaths from alcohol, drugs, and suicide.
Three Major Findings
This first article on the topic is a snapshot of what has become an important issue in the American discourse on health, well-being, and socioeconomics. An analysis of Centers for Disease Control and Prevention data from 2014-2018 with the help of the Center on Rural Innovation reveals three major findings.
On the whole, urban places are faring much better that rural ones in the Deaths of Despair data, but they are not immune. There are notable differences among different kinds of urban communities, particularly the blue-collar Middle Suburbs, where the numbers are high.
Deaths of Despair rates do not break down cleanly along white and nonwhite community lines. In particular, communities of color have vastly different experiences with Deaths of Despair. Native American communities have suffered greatly, while communities with large African Americans populations have not.
Traditional economic and educational measures of a “thriving” community are not wholly determinative. Some “struggling” communities have high Deaths of Despair numbers while others have lower ones. The finding suggests other cultural factors play a bigger role.
Diving into the data brings a fuller understanding of these points.
The ACP Frame and Findings
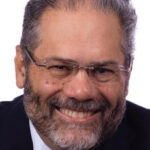
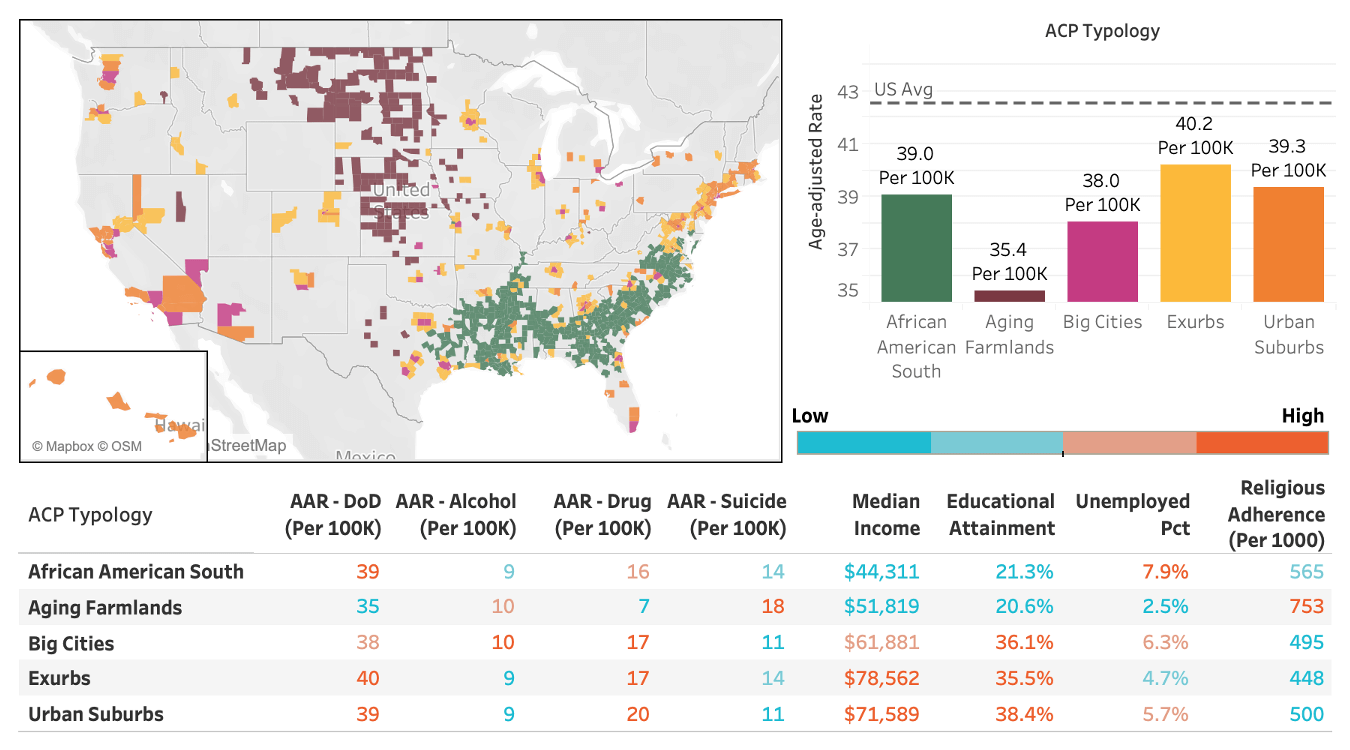
The frame for this analysis is the 15 community typology created by the American Communities Project at the county level on the map below. Click on individual counties to learn their ACP type and age-adjusted Deaths of Despair (DoD) rate — as well as the rates for each of the component elements of that figure. The side of the map displays the overall Deaths of Despair rate for each ACP type. All the rates are per 100,000 people while adjusting for age.
This analysis was done with the help of the Center on Rural Innovation using the CDC’s WONDER database. The causes of death associated with alcohol, drug, and suicide follow International Statistical Classification of Diseases and Related Health Problems 10th Revision. All Deaths of Despair cause codes are based on the codes used by Angus Deaton and Anne Case in their 2020 book, Deaths of Despair and the Future of Capitalism. A more detailed methodology can be found in this PDF: Deaths of Despair Methodology.
More Nuanced Divides than Urban/Rural
Since the phrase Deaths of Despair became a common term five years ago, much of the focus has been on rural communities’ struggles. Princeton Professors Case and Deaton published research showing increases in mortality rates among white, non-Hispanic Americans between the ages of 45 and 65 who did not hold a college degree — a group that makes up a larger percentage of rural communities.
Indeed, the National Center for Health Statistics breakdown of urban and rural counties shows that rural focus has merit. The figures below are all annual averages for the five-year period from 2014 to 2018.
As the map above shows, the Deaths of Despair rate is lowest in the most populous urban counties, and the figures tend to climb as population density falls.
Large Central Metro Counties (metropolitan hubs with more than 1 million people) have 38.3 Deaths of Despair per 100,000.
Large Metro Fringe Counties (other counties in metro areas with at least 1 million people) have 40.2 deaths per 100,000.
Medium Metro counties (between 250,000 and 1 million people) have 46.9 deaths per 100,000.
Small Metro counties (those with less than 250,000) have 47 per 100,000 people.
Micropolitan counties (between 10,000 and 50,000 people) have 48.4 Deaths of Despair per 100,000.
Non-core Metro counties (10,000 people and under) are just a bit lower at 47.4 per 100,000.
The consistent climb from largest to smallest community is not perfect but it is close. The difference between the most populous counties and the least populous is 24%. It suggests that urban communities hold advantages in the Deaths of Despair story. Perhaps closer proximity to friends and neighbors leads to less loneliness and/or more urban places have access to better resources.
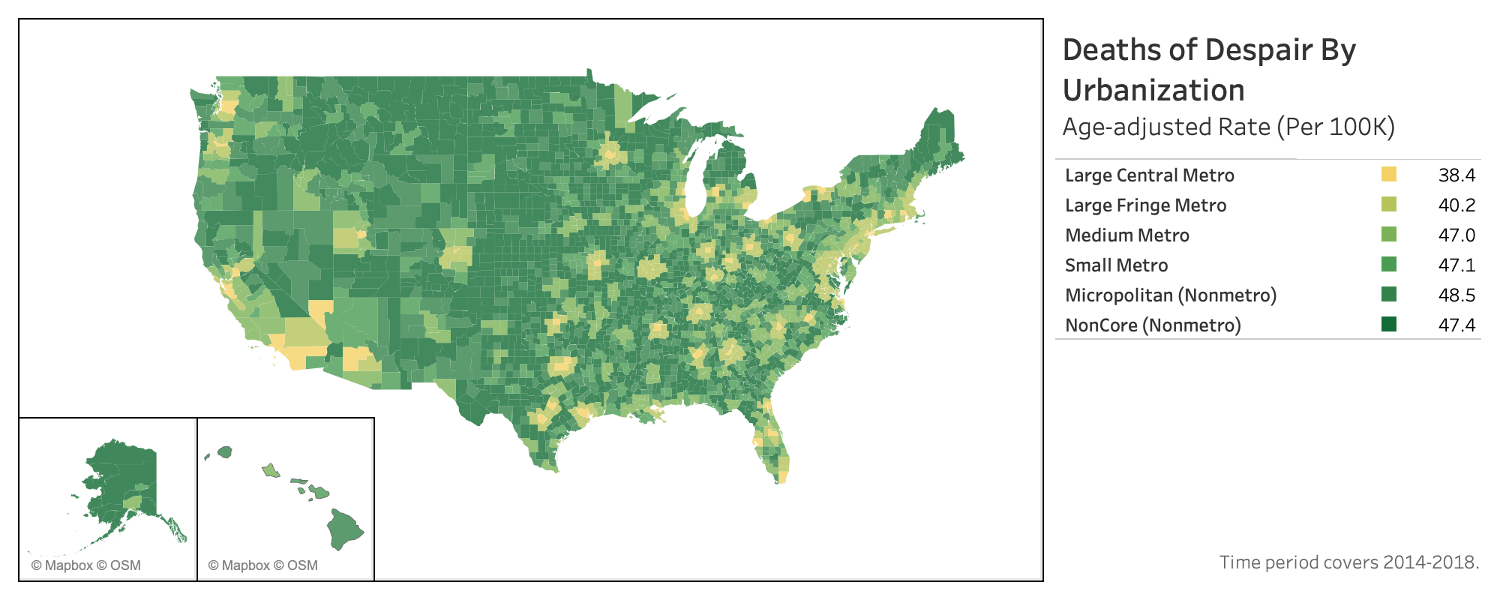
But in the ACP frame, the numbers in the most urban areas look very different, again, using averages from the same time period, 2014-2018. (See the map and chart below.)
The Big Cities, counties home to the nation’s most populous cities, come in at 38.0 deaths per 100,000 residents. Nationally, deaths are 42.5 per 100,000.
The Urban Suburbs, which tend to sit outside those big urban centers, look very similar, with 39.3 deaths per 100,000.
The less-populous Exurbs on the outskirts of many urban areas, have 40.2 deaths per 100,000 residents.
But the Middle Suburbs, a set of blue-collar urban counties based in the Industrial Midwest, are far above the others at 56.3 deaths per 100,000 residents. The figure is roughly 19% higher than the most rural county type in the National Center for Health Statistics urban-rural classification.
The differences in the data are not only regional but also more proximate.
Consider Delaware County, Ohio, an Exurb of Columbus. It has a Death of Despair rate of 24 deaths. But one county away to the northeast, the Middle Suburb of Richland County, has a rate of 65.
Outside of Detroit, Oakland County, an Urban Suburb in Michigan, has a rate of 40 deaths per 100,000, but neighboring Macomb County, a Middle Suburb, has a rate of 57 deaths.
What’s driving those distinctions is complicated.
The Middle Suburbs tend to have lower incomes than their neighboring counties and fewer college degrees, two big factors in the Deaths of Despair rate. In addition, these counties, long home to manufacturing employment, have been hit particularly hard by deindustrialization in the past 20 years. Many residents have lost union jobs, and experienced economic and health hardships as a result. Their blue-collar legacy also means some workers likely have endured repetitive stress injuries, which may have spurred greater use of prescription drugs.
Drug use is the top cause of death among the Deaths of Despair categories in the Middle Suburbs, making up more than half of all deaths at 31.7 per 100,000 people. Drugs are the leading cause of such deaths in many of the ACP community types, but not at that ratio.
The Middle Suburbs also tend to be older than other urban-oriented communities and are not adding population as fast as surrounding counties — in some cases they are losing population.
The Middle Suburbs’ hardships illustrate that the Deaths of Despair crisis does not break down neatly along the urban/rural divide.
Bright Spots and Pain Points in Communities of Color
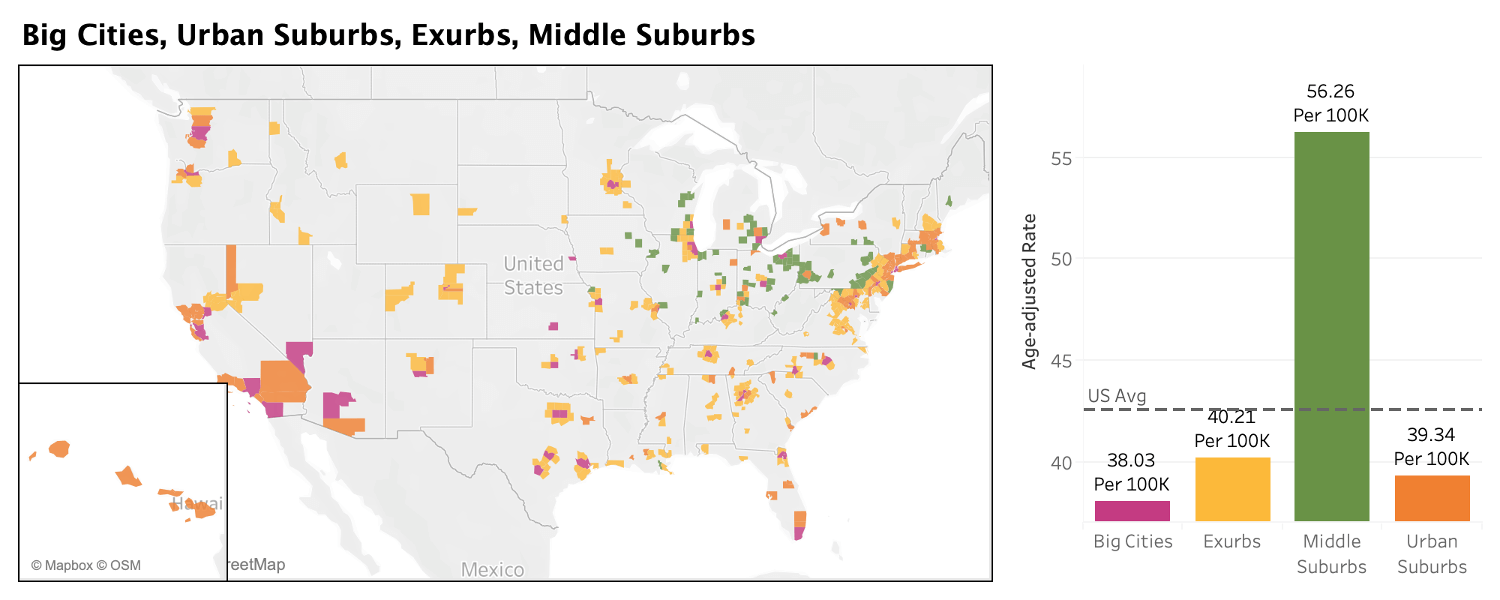
The ACP’s two recent health and well-being reports showed that the challenges for the African American South, Hispanic Centers, and Native American Lands were steeper than for other ACP community types on a range of issues, from health insurance coverage to food security.
That pattern does not hold for Deaths of Despair. The roles of race and ethnicity seem muted, when looking at the average age-adjusted rate of Deaths of Despair from 2014 to 2018.
The African American South does better than the country as a whole. Hispanic Centers do better as well. However, Native American Lands have the highest rate of death in the ACP, by far. In other words, a “minority community” does not necessarily have more Deaths of Despair. (See the map and chart below.)
Among communities of color, and among the data overall, one community type stands out: the Native American Lands. In these 43 counties, the overall Deaths of Despair rate is a staggering 101.6 per 100,000 people. The Native American communities are also nearly twice as high as the next highest community type, Graying America, which has an overall rate of 57 per 100,000.
To be sure, those high figures are driven by a few counties with the greatest struggles. In Oglala Lakota County, South Dakota, the figure is 226 per 100,000 people. In nearby Mellette County, South Dakota, the rate is 183. In 20 Native American Lands counties, the overall rate for Deaths of Despair is above 100 per 100,000. The problem runs deep.
Native American Lands contain a discrete set of counties in the ACP. Most of these 43 counties are majority Native American, and the Native American populations within them are unique. They generally live together on reservations away from others. For those reasons, this group of communities may reveal the most about the challenges of a specific racial/ethnic group. These are places where the ties between community and identity are especially strong and where the challenges are many. On reservations, residents experience poor health care and extreme poverty. Off of tribal lands, discrimination is part of everyday life. Many of these communities also bear the scars of intergenerational trauma.
The deaths in the Native American Lands are driven most heavily by alcohol. The alcohol-related death rate in these communities is 44.2 per 100,000 people. That figure is higher than the overall Deaths of Despair rate of seven of the other 14 ACP types, but alcohol is not the only hard test in these counties. The suicide rate of 31 per 100,000 is the highest of any ACP type as well.
In short, the challenges in the Native American Lands appear complicated and deeper than any one concern. While economic opportunity has long been a struggle in these places, that alone doesn’t explain the high numbers here. Isolation may play a role, as most of these communities are remote. And many Native Americans say the discrimination they face away from their tribal lands can be harsh and make reservations feel like the safest places to be.
At the other end of the spectrum, the low rate for Deaths of Despair in the African American South is striking. The numbers there, 39 per 100,000 people, are not just below the national average of about 42.5 per 100,000, but below the figures of the whiter and wealthier Exurbs, where the rate is 40.2 per 100,000.
To be clear, most counties in the African American South are not majority African American, but counties where the Black population sits above the national average of roughly 13%. Racial divides and tensions are often woven into everyday life.
Despite an uneasy environment, the overall Deaths of Despair rate or the rate on any single factor (drugs, alcohol, or suicide) is not particularly high in the African American South. The death rate from drugs is well below the national number — 15.9 per 100,000 versus 18.6 per 100,000 nationally – and the alcohol-related death rate is also lower. The suicide rate is higher than the national figure, but just marginally so. For the most part, the communities of the African American South have not been deeply affected by the Deaths of Despair problem.
Hispanic Centers also do well in the Deaths of Despair data. Their rate, 40.8 per 100,000, sits just under the national figure, 42.5 per 100,000.
Deaths of Despair here are driven heavily by one factor, alcohol. The rates for death by drug use and suicide are below the national averages. But the death rate from alcohol is well above it, 14.4 per 100,000 versus 10.2 nationally.
There is a geographic pattern to the highest spiking Hispanic Centers. Nineteen of the top 20 are in New Mexico, Texas, and Colorado — and some figures are high. In Rio Arriba County, New Mexico, there are 66 alcohol-related deaths per 100,000 people. In Cibola County, New Mexico, the rate is 44. Hispanic Centers in California and the Midwest appear to fare much better. These places are driven by agriculture and tend to have lower unemployment rates.
In total, the differences in these three types of communities of color offer evidence that being a member of minority race or ethnicity is not the prominent driver for Deaths of Despair. Other societal ills seem to have bigger impacts. Indeed, the relatively good numbers in the African American South suggest that large Black populations may be helping some communities ward off the worst aspects of the epidemic. In the coming months, we will visit communities in Georgia and Montana to explore these issues at the community level — and how different kinds of places respond.
The Roles and Limits of Income and Education
Health and well-being in the United States, measured by a long list of indicators, are often driven by two principle elements, income and educational attainment. A community with high scores in both areas tends to offer residents more services, more opportunities, and more stability. Employers want to access the labor force. Stores want to access the consumers. In the broadest sense, many human needs are more easily met.
Yet in the Deaths of Despair data, economic and educational success is not necessarily a ticket to handling the epidemic better. The nation’s highly-educated and well-to-do communities — the Urban Suburbs, Big Cities, and Exurbs — tend to do well. But a closer look at the five ACP community types with the lowest death rates per 100,000 people reveals a much more complicated picture, as the graphic below shows.
Overall, the Aging Farmlands stand out in the data, with an age-adjusted death rate of just 35.4 per 100,000 people. The densely-packed, diverse Big Cities don’t match that. Yet those rural counties look almost nothing like the educated urban enclaves on the list. Only about 21% of the adults in the Aging Farmlands have a four-year college degree. And the median household income, $51,800, is $10,000 below the amount in the Big Cities, and $20,000-or-more below the median household income rates in the Urban Suburbs and Exurbs.
Similar points hold true for the African American South, where only about 21% of adults have a four-year degree and the median household income is even lower, about $44,300. (That figure is far below the national median household income, $60,300.) Those African American South communities also have a relatively high unemployment rate, 7.8% from 2014 to 2018, compared to 5.8% percent nationally. Despite those educational and economic challenges, the African American South comes in below the national average on Deaths of Despair.
In other words, the traditional measures of socioeconomic prosperity do not necessarily mean communities fare better in the Deaths of Despair epidemic. Community types with higher median incomes and more degrees perform worse than the Aging Farmlands and African American South. In some cases, they perform much worse.
The Aging Farmlands and African American South do have their trouble spots around people ending their own lives. While both have low rates of death associated with drugs, as mentioned above, the African American South’s death rate from suicide is slightly higher than average, while the Aging Farmlands’ suicide rate is quite a bit higher than the national figure — 18.2 per 100,000 versus 13.5 per 100,000 nationally.
It could be that the overall Deaths of Despair numbers are lower in these communities because their economic situations and rural locales make accessing some drugs more difficult. Other drugs, like meth, are cheaper and more readily available.
The data suggest other elements in these communities must be making a difference, perhaps by promoting greater social cohesion and meaning. One possibility is the impact of religion.
Both the Aging Farmlands and the African American South have high religious adherence rates, 75% and 57% respectively, according to the American Religion Data Archive. Those numbers are solidly above the 49% national figure for religious adherence and also above the religion figures for the wealthier, better-educated top performing types. The faiths that dominate the Aging Farmlands and African American South are very different, but they have a common impact — helping stitch the communities together.
To be clear, religious adherence alone doesn’t appear to hold down Deaths of Despair figures. Other community types with large religious populations — the Evangelical Hubs and LDS Enclaves — have much higher Death of Despair rates per 100,000. But the specific religious traditions in the Aging Farmlands and African American South seem to be vital in holding these largely rural communities together.
Looking Forward
In the coming months, veteran reporter Ray Suarez will travel to Montana and Georgia, two states of focus in this effort, to look at how Deaths of Despair have impacted specific Native American Lands and African American South counties.
by American Communities ProjectOctober 03, 2019Print
On Sept. 26, 2019, the American Communities Project published a report on rural America, supported by the Robert Wood Johnson Foundation. Four videos from the release event follow.
Session 1: The American Communities Project Director Dante Chinni reveals report findings.
Session 2: Rural community leaders share their stories and insights with the ACP’s Ari Pinkus.
Roberto Becerril, Project Manager, Neighborhood & Development Services, City of Garden City in Finney County, Kansas
Daniel Busch, Mayor of Salem in Fulton County, Arkansas
Ellen Huber, Business Development & Communications Director, City of Mandan in Morton County, North Dakota
Ericka Nicholson, Director, Gove County Economic Development in Gove County, Kansas
Cedric Williams, Mayor of Forrest City in St. Francis County, Arkansas
Session 3: The ACP chats with Dee Davis, president of the Center for Rural Strategies, and Matthew Chase, CEO/executive director of the National Association of Counties, about key learnings and next steps.
by Dante Chinni and Ari PinkusSeptember 25, 2019Print
In 2019, rural America is a place that many discuss and debate but few actually understand well. In the minds of much of the citizenry, it is often a mythic realm, its boundaries and terrain defined by pop cultural imagery and datelines from small towns — amber waves of grain in front of an old red barn punctuated by a news account from a region defined as Appalachia.
As conversation grows about how to address or “fix” the challenges in the nation’s rural places, such a simple interpretation will no longer do.
The geographic, demographic, and socioeconomic landscape of rural America is remarkably diverse. Depending on the community in question, rural America can be hilly and remote, or it can begin at an exit off an interstate with flat lands stretching to the horizon. Its racial and ethnic composition can look like America from 50 years ago, or it can be ahead of the demographic changes that are reshaping the country. Its economy might be driven by tractors and commodity prices but more often by small factories and the retail trade.
Rural America, in other words, is not a monolith. Its wide-ranging, evolving communities have different strengths, face different trials, and need different policy solutions.
This report from the American Communities Project (ACP) at The George Washington University uses data and on-the-ground reporting to explore those differences and blow up the mythology that too often has come to define rural America. The analysis here, funded by the Robert Wood Johnson Foundation, should inform the growing discussion about the “urban/rural” divide by showing the enormous complexity underpinning the phrase “rural America” in 2019.
The work here reinforces the idea that where you live matters a great deal to how long and how well you live, even within areas collectively defined as rural. It also explores misconceptions about the relationship between health and geography. Cross-analyzing data, including numbers from the County Health Rankings and Roadmaps, Gallup, and Simmons Consumer Research, the American Communities Project’s work here illustrates the gaps in opportunities for health.
The term “rural America” is not a simple one to encapsulate. Depending on your source, there are densely populated urban metropolitan areas that hold rural terrain and, thus, could be considered rural America. At the same time, there are some definitions of rural America that exclude small-town urban centers.
The map below contains the counties that are considered rural by the Health Resources and Services Administration definition as they fit into the nine rural community types of the American Communities Project.
Across our analysis of these communities, there are six major findings — and a list of important factors driving them.
Major Findings
The physical and demographic landscape of rural America is remarkably diverse. While there is a tendency to view rural America as the cultural world portrayed in Grant Wood’s famous American Gothic painting — of a white farm couple posing with pitchfork in front of their farmhouse and barn — there are more than 500 rural counties in the African-American South, Hispanic Centers, and Native American Lands where the median white, non-Hispanic population is under the national average.
The economic challenges and opportunities in rural America vary greatly. The average median household income in the rural Latter-Day Saints (LDS) Enclaves is roughly $55,000. In the African American South, it is less than $38,000. In the LDS Enclaves, the childhood poverty rate is 15%. In the African American South communities, the rate is 33%, which is 11% above the rural median.
Education matters. The three community types with the highest unemployment rates are also below the rural America average for some college education. The data suggest that, even with the immense diversity of rural America, improving education is key to a better life and more opportunity. A push toward extending educational expectations to community college could pay large dividends.
There are stark differences in health care as evidenced in health insurance rates. In the rural Working Class Country, only 9% of the population is without health insurance. In the rural Hispanic Centers, the figure is 18%.
Some parts of rural America are seeing dramatic losses in population, but other kinds of communities are growing. Nearly 80% of the rural communities in the African American South have lost population since 2010. But fewer than 50% of the rural counties in Graying America have lost population since then — and overall the population of those counties has grown.
Infrastructure, real and digital. Across rural America, there is little correlation between population and paved roads. Some of the most densely populated places, such as the African American South, have fewer miles of road than the sparsely populated Aging Farmlands. Internet connections and speeds also look very different in different community types. In rural Hispanic Centers, 80% of the households have a high-speed Internet connection, but in Native Americans Lands, the figure drops to 40%.
These findings underscore the nuance and complexity of rural America today. The larger point behind all these differences, however, is simple. When policymakers and funders look to create rural-focused solutions, they should not focus on silver-bullet, one-size-fits-all answers. The diversity of rural America can be a strength, but it also means single solutions are unlikely to work in all rural communities.
A Snapshot in Data
Many of the differences outlined in the bullet points above can be seen on the interactive map below, click on a county or enter its name in the box to see how it compares to its larger rural type on a number of different factors.
The Nine Rural Community Types
= median of all rural counties
Population change 2010-2018
Percentage white, non-hispanic
Percentage uninsured
Percentage in fair/poor health
Percentage with at least some college education
Median household Income
Miles of road in county
Median home value
For the remainder of this chapter, we analyze data from the nine rural community types across five broad topics: demographics, economics, infrastructure, daily life, and health care.
In subsequent chapters, we explore the ACP rural landscape with profiles of six different rural communities we visited:
two counties in Arkansas — Fulton (Working Class Country) and St. Francis (African American South);
two counties in Kansas — Finney (Hispanic Centers) and Gove (Aging Farmlands); and
These profiles put faces, voices, and real communities behind the numbers. We chose places proximate to one another to show how quickly rural America can change. You can get in a car in one kind of community and get out in a completely different one, all without leaving “rural America.”
In short, in data and on the ground, rural America looks nothing like the monolith it is often portrayed as in the media and in Washington.
We believe this report is a call for a new understanding about the complicated set of places that make up the majority of the nation’s land. The different community types we outline here hold different strengths and face different challenges. They are driven by different economies and different kinds of populations. Simply put, there is no one-size-fits-all approach to policies for rural America.
We hope this report is an important step toward people gaining that understanding.
Demographics
While rural America is often thought of as a sea of similarity — largely white and generally older than the country as a whole — the demographic look and feel can change on a short drive. The races and ethnicities that define one rural community can be very different from those in a rural community nearby. And while much of rural America has seen population declines, the drops are far from uniform. The differences are stark in the community types of the ACP.
Race and Ethnicity
On the most basic level, rural America, as defined in this report, is less diverse than the nation as a whole. The median county in our collection of 2,243 rural places is 87% white, non-Hispanic. The mean for all rural counties is 78% white, non-Hispanic, still less racially and ethnically diverse than the nation overall. (In the U.S., the mean is 60% white, non-Hispanic.) But the 2,243 counties look much more complicated through the prism of the ACP typology.
Among the 306 rural counties in the African American South, the median county is only 56% white, non-Hispanic. It’s also 36% African American, almost three times the national average. In the 153 Hispanic Center counties in rural America, the median locale is only 40% white, non-Hispanic. Meanwhile, it is 53% Hispanic, almost three times the national figure of 18%. And in the rural Native American Lands communities, 43 counties, the median county is only 29% white, non-Hispanic, while it is 59% Native American.
There are outliers in the other direction, of course. In the Aging Farmlands (161 counties), Working Class Country (321 counties), and Rural Middle America (551 counties), the median counties are more than 90% white, non-Hispanic.
The broader point in the data: The overall numbers for race and ethnicity in rural America mask key subtleties. Such distinctions mean that policymakers may need a more nuanced lens as they address the challenges in these communities. Outreach and approaches that work in Gove County, Kansas (95% white, non-Hispanic) may not work as well 87 miles away in Finney County (40% white, non-Hispanic). We visited both counties for this report, and you can read profiles of each in later chapters.
That diversity also means more attention needs to be paid to the racial and ethnic differences that can define rural communities. There is a tendency to think of “rural” as meaning small and homogenous. But in some communities, such as those in the African American South, there are historic divides that serve as deeply rooted challenges that need to be addressed and overcome. We saw that dynamic on display St. Francis County, Arkansas, where the community is digging in to address the issue.
Age
Another dominant media narrative regarding rural America: It is home to a rapidly graying populace. On the whole, the 2,243 counties we examined are older than the nation at large. Using the median and the average to measure the counties, 20% of the population is 65 years or older. That compares to an overall national average of 16%, a notable four-point difference. However, this does not capture the nuance at the community level.
In several of the communities we visited, we heard that finding licensed child care was a real challenge. The strains were particularly evident in Finney County, Kansas, the Hispanic Center we visited, where local leaders are working with existing child-care providers to become licensed child-care centers.
In the Hispanic Centers and LDS Enclaves, the median figures for the 65-or-older population (15% and 16%, respectively) are close to the national average. At the other end of the spectrum are Graying America and the Aging Farmlands, where the 65-or-older population of the median county is 24%. That’s a nine-point difference in the 65-or-older population in our rural types.
The data also show that, proportionally, large populations of young people are living in parts of rural America. The median counties for seven of the nine rural types sit at or above the national average for the population under age 18, 22%. And the overall rural median and average for that age group are exactly 22%. That suggests that a key challenge in these communities is holding onto people as they pass from adolescence to adulthood, when they graduate high school and plan their next life steps. Economic opportunity, or lack of it, plays a role in those numbers. We saw and heard this while visiting rural communities.
Importantly, the Native American Lands stand out for having an extremely young population. Only 12% are 65 or older and nearly a third are under 18. But those figures are deceptive. The reason for so few older people in those communities is a very high mortality rate. The life expectancy in the median Native American Lands county is lower than the medians for the other communities we examined.
Taken together, however, these age numbers underscore the larger point: Rural America is about more than navigating retirement plans and collecting Social Security checks. In some rural communities, child-care can be as much or more of a challenge than elder care. In others, concerns center on adult battles with depression and addiction. For most of these places, a major challenge is creating jobs that will enable them hold on to people in their prime working years.
Many Sizes and Densities of Rural
The many rural communities in the 2,243 counties explored here have diverse environments and the differences become clear when examining the populations. The median county in our rural county group has a population of 17,743, but the numbers across our collection of rural counties vary sharply, creating very different kinds of places.
The data on population also reveal that rural America may not be emptying out as quickly as some suggest. On the whole, 64% of the 2,243 counties in our rural group have lost population since 2010, but in terms of raw numbers, rural America has grown by about 1.4 million in that time. To be clear, that’s very slow growth. It’s a fraction of a percentage point compared with the roughly 63 million people who live in these counties, and it lags far behind the national growth rate of 6%.
More to the point, the story of population growth or decline varies greatly by community type.
Some types, such as the African American South, have seen widespread population losses, with 79% of the group’s counties losing population. But in other places, such as Graying America, fewer than 50% of the counties have declined. And in Graying America counties collectively, the overall population number has climbed by about 174,000 since 2010.
The population losses in rural America may be felt most strongly in the Aging Farmlands. Roughly 76% of those counties have lost population since 2010 and, perhaps more important, many started from a low baseline. That means further losses can have large impacts on local businesses and schools as well as local culture and mindset. Overall, the Aging Farmlands have declined by a mere 18,000 since 2010, but that number is enough to equal an almost three percentage point drop for the type.
The news media and popular culture often focus on the urban/rural divide, and the population density of urban areas does make those places different from their rural counterparts. But the data here make clear that racial and ethnic diversity is a large part of the story in rural America. In that way, the communities of rural America are not so different from the urban areas they flow around.
The depopulation trend impacting some rural counties is not radically different from the exodus to the suburbs that remade so many metro areas in decades past. And the racial tensions in some rural communities, such as those in the African American South, are not dissimilar to those in the nation’s urban centers.
In a broader sense, all the numbers here emphasize the need for a new understanding of rural America as a multidimensional and multicultural landscape that defies simple answers and definitions. For anyone looking to effectively serve these communities, it is vital to understand the racial and ethnic complexities within them.
Economics
For many rural communities, economic development sits at the heart of local concerns and planning. Analyses that show urban America driving economic expansion are not lost on rural chambers of commerce and neither are the forecasts that show the tech sector as an engine of future growth. But as the U.S. economy is being remade, the communities of rural America bring a diversity of backgrounds and strengths to the table. Their economic paths in the coming years will almost certainly be varied as well.
Income and Inequality
Probably no single indicator encapsulates the many different rural Americas more than median household income. The range in our 2,243 counties is massive. In some places, such as the LDS Enclaves and Rural Middle America, the median income ($54,900 and $53,200, respectively) are very close to the national median ($57,600) and above the median for our rural sample ($46,600). But other communities, such as the African American South ($37,900) and Native American Lands ($41,900), lag far behind.
It’s truly a complicated picture. That’s a range of $17,000 in household income in these different kinds of rural communities. Some of those differences may be due to regional cost of living, but those disparities don’t account for the entire range. In some communities, the differences in household income are more about steeper economic challenges and deeper historical deficits.
In some communities with large populations of color, there can be other economic disparities existing within a single place. Racial divisions are often seen as an ingrained part of urban America. Stories of white flight, redlining, and socioeconomic segregation are written into the histories of most major American cities. But those same divides can appear in rural locales. For instance, in St. Francis County, Arkansas, an African American South community we visited, the median household income for African Americans is only about $28,300, while the figure for whites is more than $10,000 higher at $39,500. And stories of white flight are deeply tied to it as well. In Finney County, Kansas, a Hispanic Center we visited, the median household income for Hispanics is about $42,300, while for white, non-Hispanic households it’s $61,600. And in that county, efforts are underway to foster dialogue across groups. For example, the Garden City Cultural Relations Board consists of seven members across racial, social, ethnic, religious, and economic backgrounds, which seek to promote cultural diversity.
Income inequality has become a major topic of conversation in policy circles. While the rural communities we looked at tend to have lower scores on inequality overall, the numbers for some communities are still high. Income inequality is defined as the ratio of household income at the 80th percentile to income at the 20th percentile. Overall, the 2,243 counties we analyzed had an income inequality score of 4.4, below the national figure of 4.9. But the counties in the African American South and Native American Lands were exceptions.
Both community types scored above 5.0 on inequality, with the Native American Lands scoring the highest at 5.3. In both cases, the inequality, again, primarily stems from income differences between racial/ethnic groups. The inequality number is lower in the other big minority community type we studied, Hispanic Centers. In those communities, the inequality number, 4.5, was just above the overall rural number and below the national figure. That may be because those communities tend to hold more and better job opportunities. Certainly, we saw this in Finney County, Kansas.
Yet the larger trend in the data is that income inequality is a less prominent concern in rural America than it is in the nation as a whole. That’s the good news. The more complicated point is that such greater equality may be due to a lack of high-income households in rural America.
Occupations and Employment Opportunities
Behind some of the income differences in the 2,243 counties we looked at are differences in the industries that dominate. Rural America may be seen as the land of rolling fields and tractors, but in reality, agriculture is not a big driver of employment in most rural communities. In fact, the biggest employer in all the communities we examined was “educational service, health care, and social assistance.” More than 20% of the people in every community worked in this field, though the largest percentage of those working in the Aging Farmlands, 21%, are tied to agriculture.
In many rural communities, the schools and/or the hospital, if there is one, are the largest employers and town anchors. These institutions can’t easily close when the economy takes a downturn or pull up stakes for better opportunities elsewhere. It’s one reason these assets are crucial to their communities.
Beyond that category of work, manufacturing is still a leading employer in many of the 2,243 counties we studied. The sector accounts for 16% of the jobs in Rural Middle America and the Evangelical Hubs, 15% in the African American South and 14% in Working Class Country. Retail is also a big industry in a number of the county types. And agriculture plays a major role in the Aging Farmlands (21%), Hispanic Centers (16%), Native American Lands (10%), and LDS Enclaves (10%). In every other type, agriculture accounts for 6% or less of employment.
The Native American Lands stand out for having a higher number of jobs in “public administration” (11%), but that is due in part to the federal employees living in those communities.
The rising service sector is also less of a story in rural America. That’s because retail trade tends to have a smaller role in these communities. Smaller populations have meant fewer stores for decades and online shopping has added to that story. Online retail has also had a special impact in these communities, giving rural consumers choices they have not had available to them historically when there were one or two small stores downtown or a Walmart in the town nearby. In many of these communities “shopping local” has long offered limited options.
Education, Unemployment, and Poverty
Any serious discussion of the economy cannot exclude the important role educational attainment plays in a community’s hopes for growth and a better future. Data show the gap growing in the earning potential between those with an education beyond high school and those without one. In 2015, an analysis of Census data found that college grads earned 56% more than those whose highest level of education was a high school diploma.
A 2017 analysis form the Bureau of Labor Statistics found that the difference in weekly earnings between those with a high school diploma and those with just some college experience was $62 — that’s more than $3,200 a year, and the numbers climbed sharply as the education levels increased.
Higher levels of education, however, serve more than the workers; they serve the community as well. A better-educated populace is more likely to draw new employers and more good-paying jobs, a goal for many rural communities. Businesses increasingly want well-trained and skilled workforces that can adapt to a fast-changing economy.
And the data show educational attainment is one important area where rural America stands apart from the rest of the country. Overall, 54% of those between the ages of 25 and 44 have some time in college under their belt. That is 11 points lower than the 65% national figure for that age group. Again, however, the figures vary greatly by community type.
The numbers are particularly low in the rural communities with large populations of color. In the African American South, Hispanic Centers, and Native American Lands, the figure is under 50%. But the numbers are above 60% in Rural Middle America, the LDS Enclaves, and the Aging Farmlands, where the “some college” number sits at 68%.
Those numbers belie some of the common misconceptions about rural communities as places where education is not a top concern. The most rural of our rural county types have higher rates of educational attainment than the nation as a whole. But they also show that concerns about lower education rates among people of color should not be contained to just urban places. Again, reductionist views of rural America miss the larger point: that single solutions to challenging social problems are likely to be ineffective in rural America. While higher educational attainment is a goal for all communities, there are varying levels of need in rural communities.
Using the broadest measure of the 2,243 counties we examined, unemployment in rural America roughly matches the national average. The national unemployment rate was 4.4% in 2017, with the rural America clocking in at 4.5%. But the similarity in numbers masks a lot of nuance. In some communities, the rate was below the national figure; in others, it was above. In both cases, the percentages differed substantially among the various county types.
In the Aging Farmlands, LDS Enclaves, and Rural Middle America, the unemployment rates were 4% or lower. But in the African American South and Native American Lands, the figure stood at 6%. More interesting, the figures here don’t seem to have a common driver. For instance, the Aging Farmlands and Rural Middle America are driven by different industries (agriculture and manufacturing) and are at opposite ends of the population density scale. What’s behind the differences?
Education stands out as a factor. The three community types with the highest rates of educational attainment also have the lowest unemployment rates. The three community types with the highest unemployment rates are also below the rural America average for some college. Those data suggest that one of the best ways to help the many different economies of rural America may be to invest in improving education. An effort to make at least some time at a community college part of community expectations could be a boon to local chambers of commerce — and building relationships with those schools could pay dividends.
The one exception seems to be Hispanic Centers, which have the lowest educational attainment rates but also have an unemployment rate that matches the national average and rural America median. The vibrancy of these economies is a key reason. Many tend to be small urban hubs in larger rural areas, places that are commercial centers often with a base around agriculture processing.
When it comes to children living in poverty, the connections between educational attainment and economic opportunity are clearer.
A third of children in the African American South and Native American Lands live in poverty. The same is true for a quarter of the children in Hispanic Centers. The rates are far lower in the Aging Farmlands, Rural Middle America, and LDS Enclaves.
Financial Well-Being
Financial well-being in rural America on the whole could be improved, but there are clear fissures among different kinds of communities, according to Gallup’s recent well-being research. Note that Gallup’s breakdown encompasses all 3,100-plus counties across America. Here we zero in on the nine rural types.
At least 40% of residents in rural-oriented communities have worried about money in the past week. The most rural community types — Native American Lands and Aging Farmlands — have the highest rates at 45% each. The African American South, Working Class Country, and LDS Enclaves are close behind at 44%; Evangelical Hubs report 42%; while Hispanic Centers, Rural Middle America, and Graying America stand at 40%.
What makes this worry more tangible: More than 15% of people in predominantly rural community types say they do not have enough money to buy food. The variance runs from roughly 30% in predominantly African American, Hispanic, and Native American communities to under 20% in more moderate-income, predominantly white ones.
To be clear, none of these numbers are completely explanatory or determinative when it comes to the economic opportunities and challenges in rural America. For instance, unemployment rates may be low and education rates high in the Aging Farmlands, but there are unique challenges in those places as we heard when we visited Gove County, Kansas. High land prices combined with a trend toward massive acreage have made it tougher for young people to get started and stay in their hometowns. And while there are deep challenges in some Native American Lands, there are also innovative approaches to economic development in some communities, as illustrated by REDCO’s work in Todd County, South Dakota, home of the Rosebud Sioux Tribe. (See our community profiles on Gove and Todd counties.) Meanwhile, many of the Hispanic Centers, are seeing population growth with young non-native families and schools that need to focus on students coming from homes where English may not be spoken.
Any plan to spark economic development and change in rural America has to take those differences into account.
Infrastructure: Real World and Virtual
For an economy to thrive, people and ideas and products have to be able to move in the physical world and online. That imperative can be a challenge in rural communities. In those locales, acreage is often vast and the connections between cities, towns, and homes can be tenuous. Fewer people usually means fewer roads, and lower population densities tend to lead to less interest from telecommunications companies to hardwire homes. Those trends are clear in the data, but so are marked differences at the community-type level.
Looking at miles of road, the median rural counties in the LDS Enclaves and Rural Middle America types are at the high end of our sample at 1,273 miles and 1,152 miles respectively. At the other end of the spectrum, the median counties for the African American South and Working Class Country are not even at 900 miles of road.
More interesting in the road data, however, is the lack of a correlation between people and mileage. For instance, the community type with the highest median population, the Evangelical Hubs with more than 23,000 people, has some of the lowest numbers for miles of road at 990. Meanwhile, Rural Middle America, with a median population of more than 22,000, has a median road miles number of 1,152 — that’s 16% higher.
Some of this divide is regional and might be explained by state-level decisions on resources. The communities of the African American South also have relatively high population numbers, a median of more than 20,000, and very low numbers for miles of road. One key element they share with the Evangelical Hubs: They are largely based in the Southeast. The greater miles of road in the Aging Farmlands is also noteworthy, especially considering the low populations of those places. Perhaps it is a sign of communities that understand the importance of transportation in places that live and die by the ability to move commodities from farm to market.
When it comes to digital infrastructure, the picture is nuanced. In terms of broadband Internet access, the rural counties in our analysis do quite well on mobile connections. In all rural types, the median county has at least 98% of the population with a 5 megabytes-per-second download speed and 1 megabyte-per-second upload speed, the Federal Communications Commission’s definition of mobile broadband.
Those high mobile broadband penetration numbers are not a surprise when you visit rural communities. Even in remote locales, the mobile Internet is often the dominant connection to the outside world, for everything from road closures to crop prices.
But when the conversation shifts to a fixed connection, with much faster speeds of at least 25 Mbps per second on downloads and 3 Mbps per second for uploads, the numbers look very different. There are sharp differences across the 2,243 counties. The broadband deployment numbers in Rural Middle America, 85% of the population, are not far off from the overall U.S. figure, 94%. But the figures for other community types are much lower. In the Native American Lands, the figure is 58%. In the African American South, the figure is 68%.
But the digital divide in rural America is not just about racial and ethnic differences. The median broadband figure for the Hispanic Centers, 80%, is much higher than largely white Evangelical Hubs, which sit at 69%. That may be something of a surprise considering that the Evangelical Hubs are among the more densely populated communities in our rural sample.
In general, however, our rural counties lagged the national figures on fixed broadband deployment — some by large percentages. And in a world where everything from entertainment to work can be contingent upon a strong Internet connection, that rural lag can add to the challenges for communities that are trying to attract people and employers.
Online News and Social Infrastructure
Even with those differences and challenges in rural America, however, one tech outlet holds immense power across all the different kinds of communities we examined: Facebook. In every one of the nine rural community types, more than 40% of the people report that they visit Facebook at least once a month, according to data from the consumer research firm Simmons-MRI.
Those numbers stand out across the board in these communities when compared to other social media and news sites — from Craigslist and Twitter to FoxNews.com and CNN.com. And the comparisons aren’t really close. FoxNews.com and Twitter tend to be in the very low double-digits. Craigslist is a little higher, but doesn’t break 20% anywhere.
Facebook has become something of a one-stop everything shop in rural America — a place to keep up with friends and headlines in communities where the local newspaper has taken a hit. In smaller communities, Facebook also serves as the local yellow pages, with local businesses using the platform to host their sites. In Todd County, our Native American Lands county, we heard how people’s Facebook pages are sometimes the most reliable ways to reach them. It is the online address that never changes. Facebook may not be a government entity, but in rural America is almost serves as a public utility.
In a larger sense, these financial, employment, and infrastructure data show that there is no single, cohesive rural American economy. The 2,243 counties sit in different situations, are driven by different industries, and face different challenges.
Housing Strides and Strains
If a person’s home is often their largest investment, rural America sits in a different place than much of the nation. For the most part, these communities did not experience the housing boom that the rest of the country did in the first half of the last decade.
The median housing value in all the types we looked at was under $200,000 — and in some places, the value was far under that amount.
For instance, in Hispanic Centers, Native American Lands, Evangelical Hubs and the African American South, the median home value was less than $100,000. That gives some indication of the wealth in these communities and of a big challenge they face. Lower values mean less for the community to collect in property taxes and less individual home value for residents to borrow against.
There are, however, some upsides to those lower values, a big one being higher home ownership rates. Less valuable homes also mean more affordable homes overall. In our 2,243 rural counties, roughly 75% own their homes. That compares to a national rate of about 64%.
There are some notable differences across rural America. The Native American Lands have the lowest home ownership rate at 63%, while Aging Farmlands, Working Class Country and the LDS Enclaves are all above the 75% figure. That’s a key anchor for citizens. It’s harder to leave a community when one is a homeowner. And selling a home in a place with a declining population can be difficult.
When it comes to severe housing problems, including overcrowding, high costs, and the lack of kitchen or plumbing facilities, the disparity between communities of color and mostly white communities comes into view. Consider the 9% rate in Aging Farmlands, compared with the 21% rate in Native American Lands — and both community types are 100% rural. The U.S. overall average for housing problems stands at 18%. This suggests opportunities to build affordable housing in Native American Lands, where the population is growing. In the Aging Farmlands, where populations tend to be declining, housing rehabilitation could take priority.
Homes in rural America tend to be at least 40 years old. Many older homes are found in whiter communities with older residents. For example, the medians in Aging Farmlands and Rural Middle America top the 50-year mark; Graying America bucks this trend.
Median Age of Home Structures by Community Type
Aging Farmlands
1959
Rural Middle America
1965
Hispanic Centers
1975
Graying America
1978
Native American Lands
1978
Evangelical Hubs
1979
Working Class Country
1979
LDS Enclaves
1979.5
African American South
1980
New housing units are most robust in two younger and older predominately white communities: LDS Enclaves, where more than a quarter of the population are under 18, and Graying America, where about a quarter of the population are 62 or over. The most rural places, Aging Farmlands and Native American Lands, have seen the fewest new units.
Daily Life and Health Care
A widespread belief swirls that rural Americans grow and raise a lot of their food, and therefore have better food access. This is not the case. The Food Environment Index, which takes into account distance to the nearest food market as well as income, ranges widely in the ACP rural universe. It’s highest in Rural Middle America at 8.2 and lowest in Native American Lands at 4.9. In the African American South, where the median household income is also lower and resources seem less abundant, it’s 6.4. Meanwhile, in the Aging Farmlands, dominated by agriculture but where exporting food to other markets is the focus, the index is 7.6. This matches the median for all nine county types in rural America. In the U.S. overall, the median is 7.7.
Health-Care Gaps
Lack of health-care access is a significant pain point across rural America. For example, uninsured rates reveal a wide disparity, with white communities faring much better than communities of color. The medians by community type are below.
Hospital closures, a prevailing concern in rural America today, also vary depending on community type. Evangelical Hubs have suffered the most with 28 closures, and the African American South next with 18.
The rural hospital issue has garnered a lot of attention in recent years, and the Center for Optimizing Rural Health has examined the situation in great detail, for those interested in learning more or addressing this problem.
When a hospital closes in a rural community, the impacts stretch beyond health. An analysis from the Kansas City Federal Reserve Bank looked at communities with hospital closures between 2011 and 2016 and found subsequent declines in economic growth and net employment in those communities. Communities without closures saw their economies and net employment grow in that time.
Considering the employment data we cite in this report, those numbers are not a surprise. In every one of the nine rural community types we visited, “educational services, and health care and social assistance” was the No. 1 industry for overall employment. (It was tied for first in the Aging Farmlands.) Closing down a rural hospital kicks a leg out from under the economy in many rural places. It takes away an institution in places where those kinds of employers can be scarce.
Along the lines of limited care access, the number of primary physicians and dentists per population also varies depending on the kind of rural community in question. For seven of the eight community types, a median of one doctor serves more than 2,000 people. Only Graying America, where about a quarter of the population are age 62 or older, comes in under 2,000 people to one doctor. Compare those figures to the U.S. overall at 1,330 to 1. (Hover over the dots to see the population figures.) More rural telemedicine services could help to narrow this access gap. Meanwhile, Gove County, an Aging Farmland we visited, breaks the mold with five M.D.’s per 2,600 population.
The ratio of dentists to the rural population overall and within individual community types shows a more extreme difference than the ratio of primary care physicians. Half of the community types, including heavily African American and Latino communities, are above 3,000 to 1. Compare the rural figures to the U.S. overall at 1,460 to 1. (Hover over the dots for population details.)
Well-Being and the Future of Rural America
Key indicators show that community well-being is relatively strong in rural America, according to Gallup’s recent research. Again, note that Gallup’s breakdown encompasses all 3,100-plus counties across America. Here we look at the nine most rural types. Take community pride, for one. In all these county types, a clear majority express pride in where they live. Homogeneous LDS Enclaves, Rural Middle America, Evangelical Hubs, and Aging Farmlands climb to percentages in the high 60s and low 70s.
More than 70% of residents in rural county types report feeling safe and secure in their communities. Residents in nonwhite and more diverse communities do not feel as safe as populations in homogeneous, white communities.
There is a great deal of citizen engagement for community betterment happening in rural communities. At least 20% of residents in predominantly rural community types say they have been recognized for improving where they live in the past 12 months; nationally, the rate is the same. Only Aging Farmlands, which are 100% rural, outpace the pack at 28%. Graying America, the African American South, and Native American Lands come in at 22%. Working Class Country stands at 21%. Hispanic Centers, Evangelical Hubs, and LDS Enclaves report 20%.
Those are high scores on issues that people want addressed when they are looking for a community to call home, and these issues impact the many different kinds of rural community we studied in this report. All of which is to say, despite the challenges in some areas, rural America still has a lot to offer in 21st century America. Growing and serving it in a rapidly changing world, however, will require a new and more complex, granular understanding of the many kinds of community that define it.
To learn more about rural America and the county-level data in this report, visit:
The Center for Rural Strategies, the nonprofit that aims to build opportunities for small towns and rural communities by building coalitions and partnerships, and by advancing strategies that strengthen connections between rural and urban places. The center also runs the Daily Yonder, an online news site devoted to rural America.
The County Health Rankings and Roadmaps, the comprehensive annual analysis of health measures and their underlying factors, is a wealth of knowledge and the backbone of the data in this report.
Todd County, South Dakota, 2019. Rosebud Reservation. Photo courtesy of the Robert Wood Johnson Foundation. (c) 2019 Annabel Clark and (c) 2019 Josh Kohanek
More than a millennium before gold was discovered in South Dakota’s Black Hills in 1874, spurring the last great gold rush in the continental U.S., the Lakota people were born in these hills and roaming the surrounding plains. Today, one of seven Lakota tribes, Sicangu Lakota Oyate (“Burnt Thigh Nation”), also known as the Rosebud Sioux Tribe, is confined to the Rosebud Indian Reservation located in Todd County and parts of four other counties in the state. A Native American Lands community in south-central South Dakota bordering Nebraska, Todd County was named after John Blair Smith Todd, a Civil War general and Dakota Territory delegate to the U.S. House of Representatives.
Residents say their roots here go back at least 2,000 years, likely longer, citing research from Sinte Gleska University, the accredited four-year tribal university on the Rosebud Reservation in Mission, South Dakota, as well as NASA’s tracking of star constellations. “We plan on being here for another 2,000. This is where we come from. We can’t separate ourselves from this land. This is our home. The bones of our ancestors are buried here, and we have a sacred duty to watch over and protect it,” says Wizipan Little Elk, CEO for REDCO, Rosebud Economic Development Corporation. Formed in 1999 by the Rosebud Sioux Tribal Government, REDCO defines its purpose: “to generate revenue and create economic opportunity for the Sicangu Lakota Oyate and surrounding communities.”
What becomes clear in conversations is how trust underpins prosperity. Residents say trust has been broken and opportunity lost as a result of many U.S. government policies and practices spanning more than 150 years: severed treaties, killings, racism, forced sterilizations, forced relocations onto reservations and placements in boarding schools, and a lack of promised quality health and social services.
While the social, economic, and health adversities remain extreme in Rosebud — Todd is classified as a persistent poverty county — residents exude pride in their heritage and possess a steely mindset to bring restoration. Several organizations and institutions, including REDCO, Sinte Gleska University, Tokala Inajinyo Suicide Prevention Mentoring Program, Rosebud Sioux Tribe Head Start, and the Boys & Girls Club of Rosebud, are leading efforts to address daily problems, revolutionize Rosebud, and sustain the community’s promise for future generations.
Todd County Within Native American Lands and Rural America
Some bright spots for Todd County’s future: Its population has grown 5% since the 2010 census, countering the trend of rural America. Its youth population stands out at 41%, even among Native American Lands, where the median is 31%. In contrast, in broader rural America just 22% are under 18.
Yet the socioeconomic factors for youth are currently unfavorable. In Todd, 56% of children live in poverty, compared with 33% in Native American Lands and 22% in rural America. Nearly three-quarters (74%) live in single-parent homes. In Native American Lands, the median reaches 50%, while in rural America it’s 32%.
Todd’s median household income sits at $29,046, below the $41,900 median in Native American Lands and well below rural America’s $46,600. (In 2017, the federal poverty line was $25,094 for a family of four.)
Educational attainment is on the lower end of the scale. In Native American Lands, just 72% graduate from high school, and Todd’s rate is 56%. Compare that with the 90% median rate in rural America, according to the 2019 County Health Rankings. In Todd, 49% of 25- to 44-year-olds have some college education compared with 48% in Native American Lands and 54% in rural America overall.
On housing, 30% report severe housing problems in Todd, compared with 21% in Native American Lands and 13% in rural America. Problems include overcrowding, high costs, or lack of kitchen or plumbing facilities.
Todd struggles with many health challenges. Principally, the premature death rate is 22,124, considerably higher than the Native American Lands rate of 15,500. Both soar above the median in rural counties of 8,641, according to the Rankings. This refers to the years of potential life lost before age 75 per 100,000 population (age-adjusted).
Todd County’s teen births are 110 per 1,000 in the female population ages 15-19, much above the 65 median in Native American Lands and the 34 median in rural America.
Unlike many places in rural America, smoking is a persistent health behavior in Todd. The adult smoking rate is 39%. Native American Lands show a rate of 27%, while rural America’s is 18%.
Access to health care is very poor with a primary care provider ratio of 10,155: 1. Native American Lands’ ratio is 2,225:1, similar to rural America’s 2,288:1.
Todd’s food environment index — accounting for income and closeness to healthy food — is 5.1 compared with Native American Lands’ 4.9. Both rank much lower than rural America’s 7.6. It’s noteworthy that 41% of households in Todd County receive SNAP benefits — it’s the seventh-highest percentage in the U.S.
From Peace Treaty to Persistent Poverty: Noting History
The Lakota’s struggle to preserve their homeland has been a defining feature of life here. The 1868 Treaty of Fort Laramie was intended to bring peace between Native Americans and whites by establishing the Great Sioux Reservation, which included South Dakota, parts of northern Nebraska, and eastern Montana. That hope evaporated after Gen. George Custer led a U.S. military expedition into the Black Hills with miners seeking, then finding, gold. The 1870s were marred by war.
According to Little Elk, U.S. encroachment started with a specific strategy. “Part of that strategy was the decimation of the buffalo. The buffalo were really the lifeblood for us. We don’t really see any difference between us and the buffalo….They provided our food, our shelter, our spiritual ceremonial items, our housing for teepees, utensils. Buffalo hides, in addition to horses, were the primary item of trade, the primary currency for us.”
An intricate system of various parts including buffalo had worked together for the Lakota’s endurance. As REDCO colleague Michael LaPointe, an economic development specialist, describes: “We had a pre-reservation economy. We had forms of government, institutions, and social service systems, but … the federal government never recognized those systems as existing and instituted its own policies that were so detrimental and really decimated an entire culture, an entire group of people….
“At the end of day we’re still reeling from those effects from those policies that were instituted at the highest levels of government. So our social and economic indicators … always lag in the bottom 10 [counties in the country].”
The Community’s Quest to Upend the Status Quo
Data as the Building Blocks for Change
Bringing crucial numbers to the fore identifies where the needs lie. While the U.S. Census reports that Native Americans account for 2% of the population, the 2018 Frontline Solutions report “We Need to Change How We Think: Perspectives on Philanthropy’s Underfunding of Native Communities and Causes” found that 0.23% of philanthropic funds are given to organizations led by Native Americans. Philanthropy News Digest noted “that support for Native American organizations and causes fell by nearly 25 percent between 2006 and 2012, even as overall foundation giving increased significantly.”
REDCO is taking initiative to start from scratch with data toward helping people live healthier, more prosperous lives, says LaPointe. REDCO’s Executive Assistant Katrina Fuller has been helping with the data collection for its comprehensive economic development strategy. “It was the most difficult thing I’ve had to do because you know for a fact these numbers are all wrong. That sign in Mission says there’s what, 1,200 people here. There’s not 1,200 people in Mission; there’s a lot more than that,” Fuller says.
The discrepancies are wide and differ by source. As an example, Fuller says, the U.S. Census recorded that 13,800 people live on the reservation, the Indian Health Service reported about 29,000, and the tribe’s enrollment report listed about 34,000.
LaPointe articulates why the chasm matters. “If you’re going to end poverty, who are you going to end it for? How many? That’s a very fundamental base question. If you can’t answer that accurately, then how’s your solution going to work. These are completely moving targets, some of which REDCO’s hit and moved along. From a statistician’s point of view, there’s a lot more to be done.
“My goal is to be able to get to a point where we’re going to build econometric models and see what variables are going to have the biggest impact in turning people’s lives around,” LaPointe affirms.
Reengineering an Economy for an Undefined Future
Rosebud Casino. Photo by Megan Jula.
On the Nebraska-South Dakota border just off U.S. Route 83 stands an economic pillar: Rosebud Casino, owned and operated by the Rosebud Sioux Tribe. But generally businesses on the reservation are owned by non-natives while a majority of native enterprises run in the underground economy, says REDCO’s Development Officer Eileen “Taffy” Lafferty. These include catering, quilt-making, beading, selling wood, and being a shadetree mechanic. “You don’t pay taxes; you don’t have a business license, but you support your family. So if you look around, a lot of our kids don’t have role models of native businesses,” Lafferty says.
In similar respects, many people on the reservation only use cash and do not bank, Lafferty says. She points to the community’s fraught relationship with the only financial institution on the reservation, Wells Fargo, because of its support of the Dakota Access Pipeline. And the bank’s sole location in Mission is inconvenient for many residents who live miles away and cannot access reliable transportation.
REDCO’s Development Officer Eileen Lafferty discusses the giving versus saving mindset of residents and teaching financial literacy.
Also in Mission are two grocery stores within two miles of each other. Family-owned Turtle Creek Crossing Super Foods contains a large sit-down area for meals. Its website entreats shoppers with 10 points, including: keeping dollars in the local economy, creating local jobs, nurturing the local community, helping the environment by buying locally, and investing in local ownership. Down the road, Buche Foods, owned by a fourth-generation grocer, has a pay-at-the-pump location.
Todd County, South Dakota, 2019. Rosebud Reservation. Turtle Creek Crossing Super Foods. Photo courtesy of the Robert Wood Johnson Foundation. (c) 2019 Annabel Clark and (c) 2019 Josh Kohanek
LaPointe notes that Rosebud’s leakage rate — calculated when people leave to buy goods and services elsewhere — is high at 83%. According to the 2017 South Dakota Sales and Use Tax Report, $148 million in household income leaves the Rosebud Reservation every year, and the 2019 U.S. Bureau of Economic Analysis reported that approximately $252 million per year exists here. REDCO wants to recapture what’s leaving and capture what’s here to support more native-owned businesses.
On reservation housing, two issues predominate. The community is short 4,000 housing units, and many homes, contaminated by meth, have been boarded up.
While the community wrestles with these daily challenges, a long-range plan for Rosebud’s future is in its formative stage. As REDCO leaders prepare thick binders and update a running spreadsheet and project schedules with ideas and plans, Little Elk explains the need for detail: “Rosebud Sioux Tribe Constitution says that we have a duty to consider the impact of our decisions on the next seven generations.”
When his team had to figure out what such consideration meant for strategic planning, they decided to create a 175-year plan to explore far-reaching questions: “Where are we going to live? Where are we going to get our energy? What are we going to eat? Where are we going to get our food from? Are we going to have clean water? What does education look like? Where are we going to work? What kind of jobs are we going to have? What’s our relationship with technology going to be? What’s our relationship with AI going to be? Are we going to have a colony on Mars?… You can SWOT [Strengths, Weaknesses, Opportunities, Threats] this stuff out, looking at assets and opportunities,” Little Elk says.
The changing environment is agitating everything — but community leaders aren’t wasting time despairing. Little Elk explains, “We’ve been talking about the need to have a more holistic approach to development, locally and globally… We’re having to deal with climate change. We didn’t have anything to do with it, but we’re the ones that are being severely impacted by it….
“I think we have solutions we can provide to the rest of the globe. When we talk about farming and developing local economies and natural systems … those are going to be the solutions that are essentially going to ensure the continuing of the human race on this planet.”
It is firmly keeping with one of REDCO’s core tenets, sustainability: “Thinking of the 7th Generation and creating a self-sufficient environment. Moving away from dependence to uphold our sovereignty.”
Reasserting Lakota Culture
Quillwork and jewelry at Soldier Woman. Photo by Megan Jula.
Artwork at Soldier Woman. Photo by Megan Jula.
Just off U.S. 83 in Mission, Soldier Woman Art & Gift Gallery draws customers from around the world, carrying intricate artwork, crafts, and jewelry from Native American artists who use quill and beads among other fine materials. Artist and member of the Rosebud Sioux Tribe Linda Szabo owns and operates the gallery, where artists’ workmanship earns rave reviews online.
Linda Szabo, owner of Soldier Woman. Photo by Megan Jula.
It’s one of the many ways residents bring to light the community’s unique culture — across life stages. As Kevin DeCora, professor and chair of the human services department at Sinte Gleska University, puts it: “We have our Lakota culture, and that, in a sense, is what is really healing a lot of people and bringing back good things for these communities.”
The Lakota’s Seven Sacred Rites form the foundation to “live that spiritual way with action,” DeCora says. Two well-known ceremonies are The Sweat Lodge and The Sun Dance. Then, there’s The Making of Relatives, promoting the idea that no one is alone and there are no orphans. “We’re going to pull you into our family,” DeCora explains.
In the ceremony Preparing a Girl for Womanhood, a girl learns about her body, how to take care of herself, and how to be a mother. While away in a teepee for four days, a girl begins to understand how powerful she is. The ceremony usually occurs around a girl’s first period; DeCora says he took his daughter to one this past year. “This wasn’t happening 15 or 20 years ago,” he says, mulling if that’s because people didn’t understand what the ceremony was all about or didn’t know how it was supposed to proceed.
The Vision Quest is for boys in puberty as they take the path to become men. Boys learn how to make an altar and set it on a hill marked by a medicine man. While building their altar, they remain outside for four days and nights without food and water. “They ask the creator for a vision of how they’re going to live their life so it gives them purpose and direction,” DeCora says.
Lakota cultural elements are also woven into educational programs for children and adults. At Head Start, Director Vonda Pourier-Whipple shares how they inculcate youth.“We have our cultural basis. So they’re learning bits of the language. They label everything in our language. They try to impress upon the kids … the colors, the kinship system, certain foods, body parts….” Her team provides cultural trainings for parents by parents who teach skills they’ve mastered, like shawl-making and drum-making. “If we lose our culture and language, then we lose who we are as Sicangu Lakota Nation,” Pourier-Whipple notes.
Witnessing Triumphs and Trials in Education
Sinte Gleska University, founded in 1971 and named for a war chief and statesman, is one of 37 tribal universities in the American Indian Higher Education Consortium. The university’s mission is “to provide the people of the Sicangu Lakota Nation with an experiential-based program within the context of cultural and traditional values. All programs are designed to provide students with professional and academic skills necessary for employment and personal development.”
Sinte Gleska University. Photo by Megan Jula.
Sinte Gleska fulfills this role — and more. “It educates people and gets them out there and ready to go into jobs that are going to help people like human services,” DeCora says. “We have hundreds of graduates over 40 years that are all working with bachelor’s degrees in mental health, criminal justice, chemical dependency. So they’re working in the alcohol treatment programs, in the juvenile detention facilities, in adult correctional facilities, in the courthouses.”
One graduate making an impact is William Long, who after earning his bachelor’s degree, received the Rosebud Sioux Tribal Council’s support to start the Sicangu Youth Program in 2018, focusing on life skills.“He came through here. He understands mental health; he understands genocide, assimilation, intergenerational trauma. Now that he’s in charge, he’s starting to put mental health pieces in there to move people toward the ceremonies,” DeCora says. Long is working on his master’s degree here now.
Moving down the educational pipeline, Pourier-Whipple runs the largest tribal program as director of the Rosebud Sioux Tribe Head Start and Early Head Start. When she first started in 2010, the budget was $2.1 million. With Head Start duration funding, the budget is increasing to $6.4 million. Head Start’s child-faculty ratio is 10:1; Early Head Start’s is 4:1.
In addition to providing education, Pourier-Whipple and her team contend with entrenched social problems. “It’s intergenerational trauma. [Whether it’s] addictions, sexual abuse, it trickles down from generation to generation until you make a stand yourself and say, ‘Hey, I’m not going to live that life. I was raised that way. But I’m not going to raise my kids that way.’… It’s so hard for some people to do that. They’re enmeshed in it. ”
To help parents move onto a straighter path, parent education is available for the 315 families in Head Start and the 88 families in Early Head Start. “The problem that we run into is … the kids will tell Mom, ‘I don’t want to go to school today,’” says Pourier-Whipple. As a result, regular student attendance remains a problem.
Some parents do participate in the education designed for them, then want to become part of the team, she says. Access to attend Sinte Gleska University is a valuable incentive, Pourier-Whipple attests. Head Start pays tuition for a class, and an employee receives a pay increase after earning a degree.
“When I started in ’87…I was supposed to have an [Associate in Arts], but I was one class short,” Pourier-Whipple reveals. “After I got my AA…I got an increase…and then they paid for a class. I’m like, I think I’ll just keep going and ended up getting two bachelor’s degrees and then a master’s degree. The biggest strengths here are our college and our culture.”
Employees handle about 60 kids at a time. Their help takes many forms, including providing transportation around the reservation and even to pediatric dental appointments in Rapid City, South Dakota, more than two and a half hours away.
Currently, Head Start employs 116 people, with 25 additional positions set to open. While the program is growing, Pourier-Whipple always worries about staff outages. “On any given day, you’re going to have seven to eight people calling in, so you’re trying to scramble around. It’s people in this office who have to go in because we only have two classroom rovers.”
All teachers with degrees are paid $20 an hour, comparable to the closest school districts, but Pourier-Whipple has higher aspirations, namely that every classroom position in this program be paid more than the three surrounding school districts. “Hopefully that helps us retain our staff,” she says.
Todd County, South Dakota, 2019. Rosebud Reservation. Children involved with activities at Early Head Start. Photo courtesy of the Robert Wood Johnson Foundation. (c) 2019 Annabel Clark and (c) 2019 Josh Kohanek
Turning Over Well-Being Challenges
Tokala Inajinyo Suicide Prevention Mentoring Program confronts the problem of suicide head on by training youth to be peer mentors. Project Coordinator Jessica Two Eagle, who started here as a counselor in 2014, reveals her motivation for working in this field: “I would say from a young age, losing a lot of classmates from suicide.”
Today, she says social media is one of the bigger stressors for young people and affects the unrealistic expectations they have for themselves. It’s leading to suicidal thoughts at younger ages.
In addition to offering suicide prevention services for youth and adults, the program meets groups in jail and the Juvenile Detention Center, and conducts anger management classes for the public. Opportunities to explore spirituality are available, too. The program regularly hosts events for the Rosebud Sioux Tribe’s 20 communities, and staff spread the word to outlying communities through social media, radio, and fliers. They also provide QPR (question, persuade, refer) training to help people recognize the warning signs of suicide and intervene.
For his part, DeCora says he’s certified 216 high school students in QPR. He’s also a master trainer for Applied Suicide Intervention Skills Training (ASIST), which he applies all over the area.
Finding Purpose Among Youth
Entrance to the Boys & Girls Club of Rosebud. Photo by Megan Jula.
Another positive force for youth is the Boys & Girls Club of Rosebud, which includes centers in Mission, Rosebud, and Parmelee, South Dakota. The staff comprises seven full-timers and 19 part-timers among the three locations. Executive Director Glen Marshall, who grew up in the suburbs of Minneapolis, Minnesota, finds purpose in helping children here develop. “I love that I get to do this, working with youth, providing something that would not be there otherwise, like our dinner program, or lacrosse, or baseball, or whatever,” he says.
About 485 kids are enrolled in the program, and about 135 kids attend the club daily, Marshall says. The elementary school program encompasses grades K-5 while the teen program includes grades 6-12. Two points of pride: turning a ’60s bowling alley and restaurant into an active teen center and starting a new academic tracking system.
The club uses its Facebook page to share updates of activities and events. For kids from low-income families whose phones may have been shut off or their phone numbers changed, Facebook is a steady communication channel because people can log in to their profile using someone else’s phone. Staff often use Facebook Messenger to communicate with parents because it can be the best way to get ahold of them, Marshall says.
What keeps him up at night are “kids with really bad home lives, with a lack of support and safety they need.” At the same time, Marshall sees a lot of hope: “We’ve got some youth coming up that are really motivated with an understanding of their culture…there’s a lot of people making efforts in that area.”
From Local to Global: Recognizing Universal Connections
As residents describe how culture and spiritual practices connect them to one another, REDCO’s Wizipan Little Elk stresses what binds the Lakota to all humanity. “We want what everyone wants: to have a say over our land, to be able to worship God, and to raise families in a safe and healthy environment. I think sometimes people like to get all mystical about everything… but we are the same as everybody else in those respects. We have our own language, and we have our own stories; we have our own customs and cultural practices and beliefs. That’s just what makes us unique, like any other group of people in the world,” he says.
Todd County, South Dakota, 2019. Rosebud Reservation. Photo courtesy of the Robert Wood Johnson Foundation. (c) 2019 Annabel Clark and (c) 2019 Josh Kohanek

 John Drury is City Manager for Tavares, Florida.
 Annie Ansell is Executive Director of Dysart Community Center in El Mirage, Arizona. The organization provides educational and developmental opportunities for low-income children and adults in the Northwest Valley of Phoenix.
 Wayman P. Britt is Kent County Administrator.