Dallas County, Texas: The Big City

by Ari Pinkus and Dante Chinni October 03, 2018 Print
The new Klyde Warren Park in downtown Dallas offers walking paths, playgrounds and stunning views of the city. Photo credits: Elizabeth Sherwood

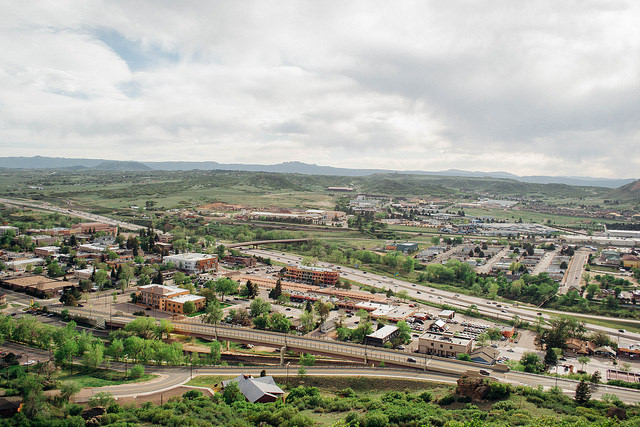
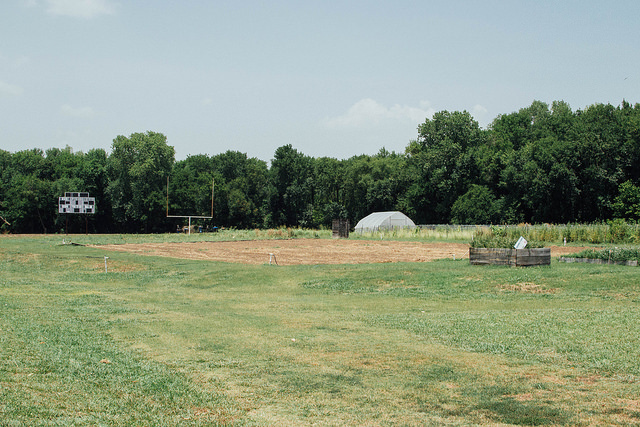
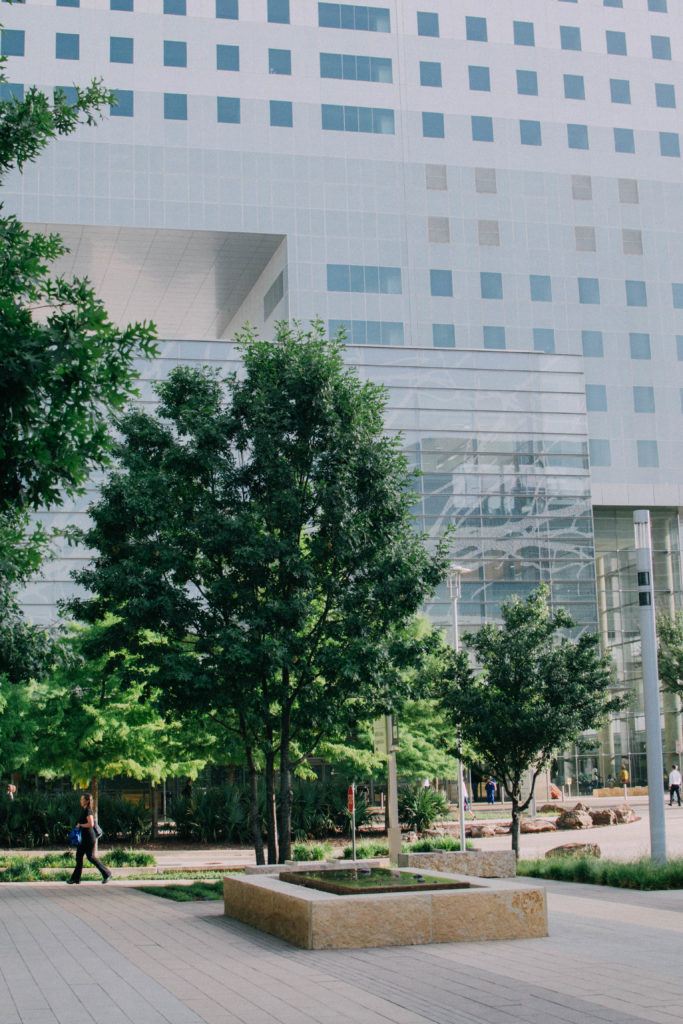
The best way to get a sense of Dallas County may be to drive between its northwest and southeast corners. In the northwest, you drive through the office parks, golf courses and tightly-packed mansions of Valley Ranch. In the southeast, you will find small Paul Quinn College, a Historically Black institution that has brought itself back from the brink and converted its old football field into an organic farm.

Those two areas and the 25 miles between them tell the story of a Big City county that must balance the wants and needs of an immensely complicated set of communities.

The physical landscape makes plain the divides; Trinity River and Interstate 30 mark the demarcation between the northern and southern sectors of the city. The city center is carved up by highway with green space interspersed. 55% of residents live north of the River while 45% live south. The median home value in the zip code 75230 in North Dallas is $497,400.

In contrast, in Paul Quinn College’s zip code 75241, the median home value is $75,800. Yet southern Dallas, encompassing 185 square miles, contains about 54 percent of the city’s area. (All of Atlanta would fit within it.) It exists in the same county as North Dallas, but feels a world away.

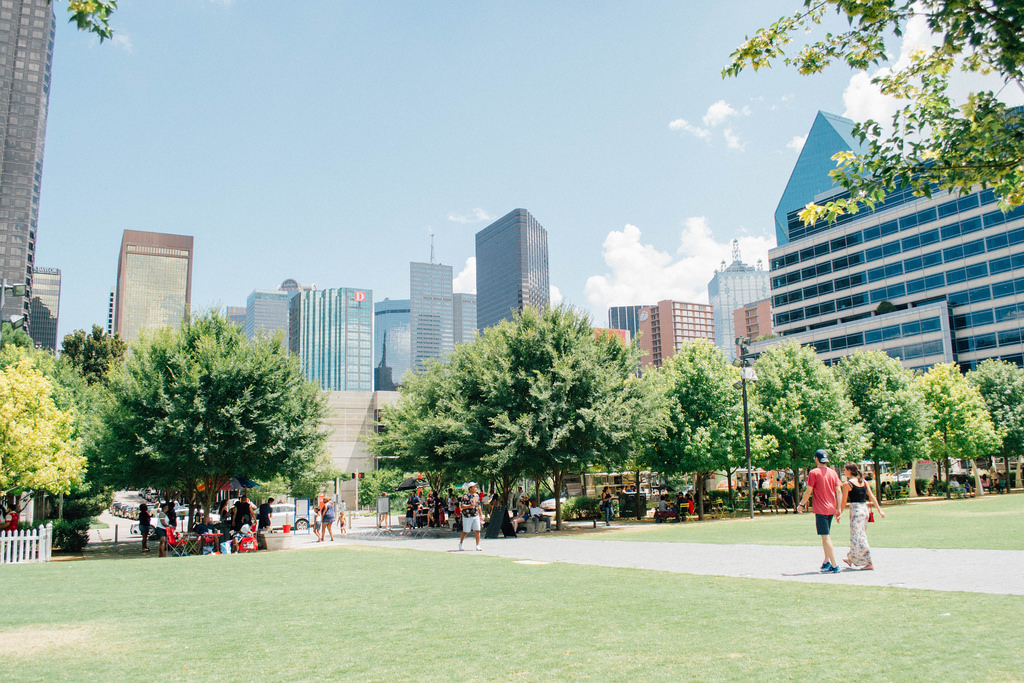
Dallas County as a Big City

Dallas County (pop. 2,574,984) has many characteristics of a vast urban center: diversity — 40% Hispanic, 29% white, 23% African American, 6.5% Asian, 1% Native American, 23% foreign born and plenty of out-of-state transplants — as well as the strains of economic inequality and segregation.

In its diversity characteristics, Dallas County fares better than other Big Cities, according to the 2018 County Health Rankings.

  • Dallas County’s residential segregation score between blacks and whites, at 49, is lower than the 53 median for Big Cities.
  • The same is true of the residential segregation between nonwhites and whites, where Dallas County comes in at 37; the Big Cities median is 42.
  • Income inequality, defined as ratio of household income at the 80th percentile to income at the 20th percentile, stands at 4.7, a couple of notches below the Big Cities median of 4.9.

Other numbers underscore Dallas County’s ongoing difficulties in residents’ access to care and overall health: The uninsured rates for adults and children are 27% and 11%, respectively. In Big Cities, the median rate of adults uninsured is 14%; for children, it’s down to 4%.

In Dallas County, the ratio of the population to primary care physicians is 1,450:1; for Big Cities, the ratio stands at 1,150:1. A similar situation exists in the ratio of the population to mental health providers. In Dallas County, it’s 780:1; in Big Cities, the median is 337:1.

When it comes to overall health in Dallas County, 19% report being in poor or fair health; for Big Cities, 17% say so.

Efforts to close the gaps are multifold in Dallas County:

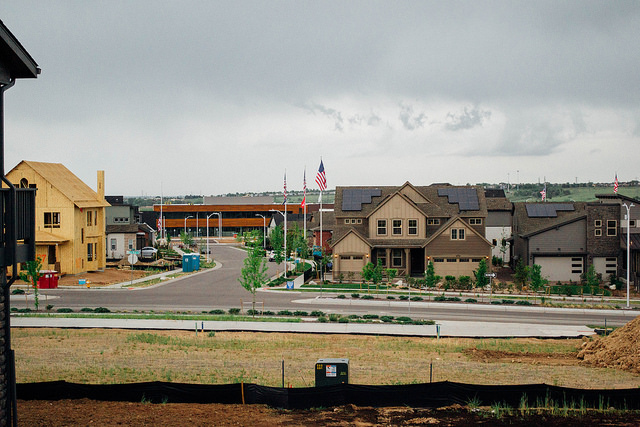
  • The city of Dallas is fulfilling a strategy to promote sustainable growth in its southern sector.
  • Parkland Hospital focuses on the social and economic factors shaping health. Collaborations with area nonprofits help to coordinate care.
  • The Dallas Office of Welcoming Communities and Immigrant Affairs was established in March 2017 with an eye toward equity and connected communities.
  • Philanthropic work is helping to improve and integrate mental healthcare services more seamlessly into the community.

The View from the Southeast

Michael Sorrell, President, Paul Quinn College, HBCU

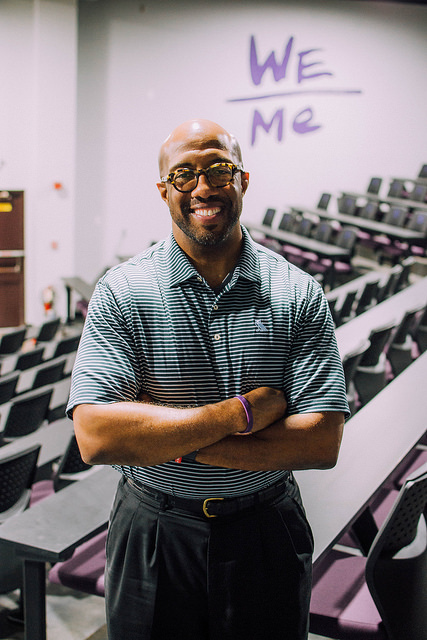
“I want you to remake America and get it right,” Paul Quinn College President Michael Sorrell commanded some 60 incoming freshmen in class on a 100-degree, July day. The historically black college in southern Dallas was founded in 1872 by African Methodist Episcopal Church preachers to provide an education to newly free African Americans.

Sorrell assigned his students to create a new economic model to replace slavery in 1860 just before the Civil War. He implored them to not merely focus on freeing slaves but explain how they would build a blended community — and lead everyone.

The project highlights a signature lesson Sorrell imparts to all Quinnites: “You have the ability to create the environment that you want to see… you are the entrepreneurs of your lives.”

Sorrell works with such a mindset. When he took over Paul Quinn in 2007, it was edging toward closure; just 151 students were enrolled. Since then, he’s positioned the institution to move the needle on the most intractable problems in the Highland Hills neighborhood of South Dallas and society at large. Paul Quinn adopted the work college model — the first urban college to do so — requiring all students who live on campus to work for the school. This has reduced student tuition and fees and enables students to graduate with less than $10,000 of student-loan debt.

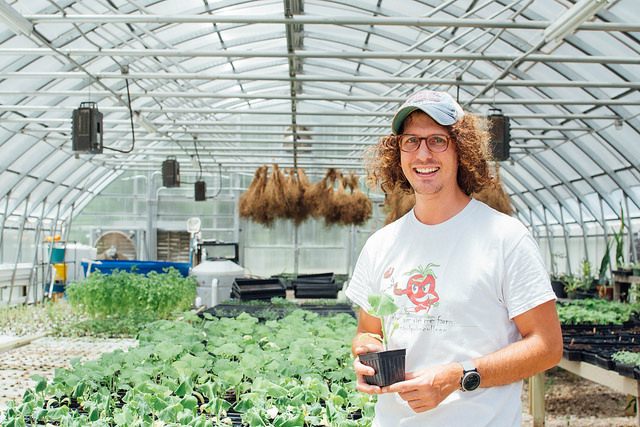
Through a partnership with PepsiCo, in 2010, he turned the school’s football field into the “We Over Me” farm that employs students and grows a myriad of organic produce. The sustained effort is slowly opening an oasis in a recognized food desert. In 2016, after years of stakeholders’ persistence, a grocery store, Save-a-Lot, opened across from the school.

Paul Quinn, too, has blossomed during Sorrell’s tenure. Today, the school enrolls 550 students, and in July, Sorrell announced plans to open a second campus in Plano, Texas, a wealthy suburb just north of Dallas County, in the 2018-2019 academic year.

Listen to Michael Sorrell, president of Paul Quinn College, a Historically Black College in southern Dallas, describe a way to attack poverty, drawing on his parents’ backgrounds and his upbringing.

Developing the Economy in Southern Dallas

GrowSouth is a strategy to promote sustainable growth in southern Dallas. Toward this end, Dallas City Council in June approved $22 million to redevelop Red Bird Mall (known today as Southwest Center Mall) — at the intersection of two major highways, Highway 67 and Interstate 20 — a cultural and commercial landmark that opened in 1975 but is now nearly empty.

Investor Peter Brodsky, who purchased the mall in 2015, is poised to realize a vision of bringing high-quality amenities to the underserved population of southern Dallas County. Plans for the 78-acre project include restaurants, a movie theater, a hotel, green space, office space, a 25,000-square-foot workforce development center and a special Starbucks with space for meetings and job training for 100 people a year. Brodsky’s team also seeks to turn part of the mall into a medical hub with 50,000 to 70,000 square feet in outpatient clinics, he says. While there are concerns about gentrification, he notes that leaders for Red Bird are being drawn from a talent pool of nearby residents who understand the community’s needs and what resonates.

Brodsky has faced skepticism about his intentions and his ability to make good on his promises, he says. However, friends have vouched for him, and he’s never turned down meeting with stakeholders, including homeowners’ associations, churches, mall walker groups and realtors. He’s opened community meetings with candor: “I want to acknowledge that the sight of a North Dallas businessman announcing they’ve bought an asset that you’re proud of fills you with dread and makes you wonder, not if you’re going to get screwed, but how you’re going to get screwed, and then, I acknowledge the history,” he says.

In these forums, he’s listened intently — with promising response. Putting in an incubator space, designed for entrepreneurs and mentorship, came from community members; the Dallas Entrepreneur Center will open this fall.

Brodsky’s team plans to break ground on the $157 million project in early 2019. Could it become a model for other cities? Brodsky hopes so.

Building Pillars of Equity and Connection

Dallas is pushing to create a more inclusive culture in other ways. The Dallas Office of Welcoming Communities and Immigrant Affairs, established in March 2017, acts as a convener on the “Welcoming America” framework, the pillars of which include equity; and safe, healthy and connected communities. A task force of 85 residents formed, encompassing leaders of immigrant-serving organizations, three medical doctors, a psychologist, social workers and public health workers. The group is focused on how to continue becoming a welcoming community.

Fear is considered one of the greatest barriers immigrants face in Dallas, says Director Mary Elizabeth Cedillo-Pereira. One way the group addresses it is by examining how children are being impacted by the policies of separation and deportation as well as fears of bullying.

The office has kicked off a citizenship campaign based on research that about 46,000 residents qualify for citizenship but haven’t applied, says Cedillo-Pereira. The reasons: fears of taking the test, language barriers and lack of education literacy. On the language front, the city council recently increased funding for an ESL program.

A longtime resident of Dallas, Cedillo-Pereira says she’s noticed a renaissance in the immigrant community and more emphasis on inclusive diversity. Next generation leaders are emerging, while the city’s various ethnic groups — Latinos, African Americans and Native Americans — are coming together to preserve their groups’ histories.

Parkland Hospital’s Roots and Wings

Parkland Memorial Hospital is Dallas County’s public hospital.

In the meantime, the effects of segregation continue to manifest in community healthcare. The uninsured rate in the county stands at 23%; in Dallas, it climbs to 28%. The south-central part of Dallas is a medical desert. The public hospital, Parkland Memorial Hospital part of Parkland Hospital & Health System, acts as the county’s primary safety net; the uninsured rate here reaches 45%. The Dallas County Community Health Needs Assessment recently highlighted strengths of the public health system, including national experts, strong intervention infrastructure and maternal and child health resources.

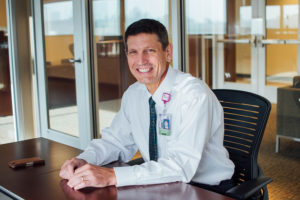
In November 2008, 82% of Dallas County residents voted for a bond measure to build a new, 1.9 million-square-foot facility for Parkland that most will never personally use. One-third of the $1.8 billion hospital budget is supported by county tax revenue. “It’s a pretty conservative state, but Dallas County supports its public hospital. There’s a lot of pride in Parkland,” says Dr. Frederick Cerise, CEO of Parkland.

Frederick Cerise, CEO, Parkland Health and Hospital System

Residents cite a desire for the best public services available, a charitable spirit, the hospital’s longevity — it was founded in 1894 — and its historical significance. After President John Kennedy was shot while riding in a motorcade through Dealey Plaza in downtown Dallas, he was brought to Parkland where doctors tried to save his life. Nearby, the Sixth Floor Dealey Plaza Museum commemorates Kennedy’s life, death, and legacy — located in the same spot where Lee Harvey Oswald shot and killed the president in November 1963.

Lately, Parkland has been tackling the social determinants of health to a greater degree. It’s a mindset shift for the hospital, Dr. Cerise says. Collaborations among nearly 100 community nonprofits, including the North Texas Food Bank, large shelters and faith-based institutions, share information about patients to better coordinate care. Cerise is a member of a task force on homelessness. As of spring 2018, the number of unsheltered homeless in Dallas County tallied 1,225, according the Metro Dallas Homeless Alliance.

Commerce and Philanthropy Spur Healthcare Innovation

The three-year-old, state-of-the-art facility notwithstanding, Parkland faces challenges of its own. The state’s decision to not expand Medicaid curtails access to care and makes planning to meet patient demand more unpredictable, Cerise says. The demand for services remains high, whether it’s trauma, chronic disease, substance abuse or behavioral and mental health illnesses, says Cerise.

The hospital looked to industry to improve its processes in the new facility. Experts from Toyota, a new employer in the Dallas metro area, came to Parkland to analyze patient flow in the emergency department and helped reduce discharge times.

In the same vein, Parkland is working to deliver care differently. An infectious disease doctor has been teaching patients to give themselves intravenous antibiotics, which has saved the hospital $40 million in five years, Cerise estimates. Moreover, an analysis found that email consultations can cover 60% of new referrals, and these are being used more frequently, particularly in dermatology cases. The method also helps patients who can’t come to the hospital.

Commerce and healthcare coalesce often in Dallas County — and the seeds of change are rooted here. In an office abutting a golf course in Irving, northwest of the city, President/CEO of Dallas-Ft. Worth Hospital Council (DFWHC) Stephen Love looks to link the two areas in his advocacy of hospitals. In 2017, DFWHC released an economic impact study showing that healthcare is the second largest sector in North Texas, accounting for $18.4 billion in labor income. Achieving cost efficiency in care and educating people to be healthier are key priorities for the Council.

For example, DFWHC and its Foundation are pushing for North Texas to become smoke-free, one city at a time, in order to boost health, save costs and increase workplace productivity. The city of Dallas prohibited smoking in restaurants in 2008, and has been expanding its scope, most recently to public parks in March. On smoking rates, Texas is among the top U.S. performers with a rate of 14%, according to the 2018 County Health Rankings. Dallas County’s rate stands at 15%.

Philanthropy, too, is driving healthcare progress here. According to The Chronicle of Philanthropy, Dallas is the eighth most charitable city in America. The two dovetail in the area of behavioral and mental health, a top priority for Dallas, according to the county assessment.

The Meadows Foundation has raised the visibility of mental illness through partnerships with state and local governments, grantees and philanthropic colleagues. An outgrowth of the foundation, The Meadows Mental Health Policy Institute (texasstateofmind.org), based in Dallas, Austin and Houston, provides policy research and development to improve mental health services in Texas.

President and CEO Andy Keller outlined some the institute’s overall goals in terms of their impact on Texans:

  1. no one in jail solely for mental illness;
  2. no child suspended or expelled from school because of untreated mental health conditions, including trauma;
  3. 100% detection and treatment of depression; and
  4. 100% detection and treatment of psychosis.

The institute has moved steadily forward. One five-year initiative, the Dallas County Caruth Smart Justice Project, aims for Dallas to cut in half the population in jail for no other reason than mental illness. Another with promising results seeks to expand integrated mental healthcare within children’s primary care. Children’s Health in Dallas initiated this program to help to diagnose and treat mental illness, reaching more than 80,000 children on Medicaid. Now the institute is partnering with Children’s Health, Texas Children’s Hospital and Texas medical schools to bring the program statewide with support from foundations and the state senate leaders who have prioritized mental health.

Texas has made notable advances in this area. In 2016-2017, the legislature on a bipartisan basis passed 13 bills designed to improve mental healthcare. One bill created a $37.5 million grant program to reduce arrest, incarceration and recidivism among people with mental illness. Another provides payment for adolescent mental health screenings. Biennium spending for mental and behavioral health has increased from under $7 billion to more than $8 billion, underscoring that this issue is more uniting and central than ever.


Douglas County, Colorado: The Exurb

by Ari Pinkus and Dante Chinni October 03, 2018 Print
Sandstone Ranch in Douglas County, Colorado, features several pastures and fields with hills and unique rock formations in all directions. Photo credits: Elizabeth Sherwood

Sandstone Ranch, encompassing 2,083 acres along the foothills between Denver and Colorado Springs, is a crown jewel of Douglas County, Colorado. After the county purchased the $18.75 million ranch in January partly with money from its open space fund, Board of County Commissioners Vice Chair Roger Partridge declared: “It is the preservation of the County’s history, heritage, wildlife habitat, as well as other cultural and natural resources — a quality of life investment for present and future generations.”

A foot bridge hovers over a small pond on the grounds of Sandstone Ranch in Douglas County. 

Douglas County as an Exurb: Where Quality of Life Meets Warp-Speed Growth

“Quality of life is the most important outcome of our work,” Douglas County asserts on its website. By key measures it’s succeeding: Douglas is Colorado’s healthiest county in terms of both quality of life and length of life, according to the County Health Rankings in 2018 and 2017. More validation: When county voters were asked in an independent survey about whether Douglas is “a good place to raise a family,” 97 percent agreed, according to the results from June 2017.

Recreational areas abound in Douglas, where many residents are outdoor fitness enthusiasts. More than 63,000 acres of the county’s 843 square miles are protected through the Douglas County Open Space Program. Pike National Forest, Roxborough State Park, Castlewood Canyon State Park and the Chatfield State Recreation Area compose more than 146,000 acres.

That many residents here maintain healthy lifestyles is evident in the 2018 County Health Rankings. Physical inactivity is a low 10% compared with a median 24% in the Exurbs. In all other community types, the median for this category ranges between 21% to 32%. The adult obesity rate is 18% compared with the Exurban median of 30%. Abundant exercise opportunities are noted in the Rankings — 93% have access in Douglas compared with 78% in the Exurbs.

While the panoramic vistas and fresh mountain air distinguish Douglas County among America’s 222 Exurbs, the rural terrain and increased density closer to the metro areas (Denver and Colorado Springs) are signature characteristics of this community type. Also following Exurban trends is Douglas’s lack of racial and ethnic diversity: Hispanics make up 8% of the population, Asian Americans 5% and African Americans 1%.

The county’s health factors are solid. Residents are well-educated, with 58% holding bachelor’s degrees; the median household income at $112,400 is well above the national average. Just 3% of children are in poverty in Douglas; the Exurban median stands at 18%, according to the Rankings. Moreover, the violent crime rate, defined as the number of reported violent crime offenses per 100,000 population, stands at 82 in Douglas; the median reaches 160 in the Exurbs overall.

The biggest way Douglas stands apart from its Exurban peers: It’s in the thick of warp-speed growth, skyrocketing from a population of 285,465 in the 2010 Census to 328,632 in the 2016 Census Population Estimates. Seemingly in an adolescent growth stage, Douglas is more clearly defining itself and what it wants to become. The 2017 survey showed that 81% of county voters believe Douglas is growing too fast.

Hardly content, residents bring an intentional and responsive mindset to the most pressing challenges affecting the county’s overall health: mental health, the availability and affordability of housing and funding the transportation infrastructure improvements needed to mitigate congestion and increase safety. Their practical solutions are yielding results — and helping the county continue growing up strong.

A few initiatives, programs and plans stand out:

  • Through the Douglas County Mental Health Initiative, supported by the county commissioners, 40 community partners help connect people with mental health services they need. Since May 2017, the county has created two Community Response Teams — and is achieving promising results.
  • A master plan with many modes of transportation is in the works; the county is also helping seniors, people with disabilities, low-income residents and others get from point to point through a partnership with Lyft and faith-based organizations.
  • The Regional Transit District is extending light rail lines in the county.

Defining and Meeting Mental Health Challenges

Douglas County is attuned to mental health, an issue that takes different forms. Social connectedness is considered crucial to individual and community health, and social associations are a measure for this. According to the County Health Rankings, social associations in Douglas County stand at 5.9 per 10,000 population; in Colorado, the number reaches 8.7; in the Exurbs nationwide, the figure is 9. In comparison, the top U.S. performers post a rate of 22.1.

Douglas County also contends with binge drinking and substance abuse, affecting mental health, says Dr. John Douglas, executive director of the Tri-County Health Department.

Suicides are the most heart-wrenching, extreme end of the spectrum. In June, the Centers for Disease Control and Prevention’s national study on suicide rates across America showed that Colorado’s rate spiked 34% between 1999 and 2016. (The national study revealed that more than half of those who died by suicide did not have a diagnosed mental health condition.) Still in the minds of residents here are the 1999 Columbine High School massacre in Littleton and the 2012 movie theater mass shooting in Aurora, both in adjacent Arapahoe County.

Dr. John Douglas, Executive Director, Tri-County Health Department.

Since 2014, the Tri-County Health Department — including Douglas, Adams and Arapahoe counties — has been laser-focused on mental health in its public health improvement plan. “In very preliminary feedback, access to mental healthcare and mental health remain the top two community health concerns,” says Dr. Douglas.

Douglas County has been tackling the issue head-on after a series of tragic incidents in the past few years. The Douglas County Mental Health Initiative, supported by the county commissioners, has gathered community partners to meet residents’ mental health needs. Meeting regularly are more than 50 people from 40 institutions across the county, including health, police, courts, media, churches and schools. The county also teams with Tri-County Health on the “Let’s Talk Colorado” campaign to decrease the stigma around mental illness, and through conversation, encourages people seek help if they need it. Meanwhile, Colorado Community Media, which covers Douglas County, has been writing a multipart “Time To Talk” series and holding community forums on mental health issues.

Also on the ground is the Community Response Team (CRT), formed in May 2017 as part of the county’s initiative. Composed of fire/EMS, law enforcement and a clinician from a private psychology practice contracted by the county, the CRT is dispatched to the scene of a mental health situation. The team responds to calls from 911 and other sources, evaluates people on scene, steers them from emergency rooms and jail and connects them with the necessary mental health services. In January, the county added a second CRT; each one has a case manager. The county has added case management software to better coordinate care.

The results are encouraging: Of the 1,001 encounters from May 2017 to May 2018, the CRTs have prevented 142 emergency department visits and 53 arrests, according to the county’s recent data. The CRTs referred 163 people for case management and 75% successfully engaged. The county estimates it’s avoided more than $1.7 million in costs to emergency departments, EMS/fire and detention facilities.

Besides the CRT, the county employs a Mental Health Navigator to handle mental health needs coming to the County Attorney. The navigator works with clients on a specialized care plan and helps families move through the system.

Listen to Dr. John Douglas, executive director of the Tri-County Health Department, talk about the attributes of Douglas County, Colorado, as well as why and how the county addresses the issue of mental health. 

A Vibrant Economic Landscape

Douglas County broadly appeals for its lifestyle, safety and economy. When voters were asked in the 2017 survey whether Douglas is “a safe place to live and work,” 98% said the statement was accurate.

Frank Gray, President/CEO, Castle Rock Economic Development Council.

The county and residents embrace small government and letting the individual prosper — of particular interest to businesses. Douglas is home to Fortune 500 companies: DISH Network, Liberty Media, Charles Schwab and Qurate Retail. Where unemployment is under 3%, the top sector is professional and business services. Other major industries are telecommunications, healthcare, financial services, retail and leisure and hospitality. The Outlets at Castle Rock, filled with brand name retailers in the county seat, is the No. 4 tourist attraction in Colorado, according to the Colorado Tourism Office. With property taxes low, sales tax is a key revenue generator, says Frank Gray, President/CEO of the Castle Rock Economic Development Council.

Downtown Castle Rock, Colorado, the county seat of Douglas County, features small-town charm.

Housing Needs Surge

Although Douglas County was founded in 1861, its growth is relatively recent, and some sectors are working hard to keep pace. Demographic shifts present particular challenges in housing. At the same time people of varying ages continue to migrate to Douglas from other areas, many residents are choosing to age in place. The median age in Douglas County is 37.8. The State Demography Office projects that by 2030 about one in four residents will be age 60 or older.

Sterling Ranch, a $4.4 billion development in northwest Douglas County, is being built to meet the needs of a growing, multigenerational population.

Multigenerational housing is being built to accommodate. One master-planned community is Sterling Ranch, a $4.4 billion, sustainable development in the northwestern part of the county, located near two state parks and three regional parks. Homes range from the $400,000s to more than a million. The first village, which has welcomed more than 100 families so far, is slated for about 800 homes built in authentic Colorado architectural style. Plans are to build more than 12,000 homes in Sterling Ranch within the next 25 years, housing more than 30,000 people. In addition to homes and recreation, the 3,400-acre development will feature churches, schools and shops.

Some 15 miles east in affluent Lone Tree, where the median price of a single family home is $591,000, sits RidgeGate, a 3,500-acre mixed-use, sustainable community of homes, retail and restaurants, parks and open space, the Sky Ridge Medical Center, office space and light rail.

In 2017, 3,416 new housing units were completed all over Douglas County, representing a 2.8% increase in housing stock from 2016. The median price of all homes sold in the third quarter of 2017 was $456,013, an increase of 5.4% compared with the same time frame in 2016, according to county data.

On affordable housing, Douglas County could do more to help middle and low-income earners, such as teachers, police officers and retail workers, say Douglas County Housing Partnership leaders Diane Leavesley and Artie Lehl. Douglas County Housing Partnership works with private sector developers to offer rental housing built with low income housing tax credits (LIHTC) and other programs.

The Housing Partnership provides down payment assistance for first-time homebuyers who have incomes at or below 80% of the area median income, but the purchase price cannot exceed $361,000. (For a new build, it’s $413,000.) This essentially puts prospective buyers in the condo market.

In spite of the challenges, different types of housing are getting the green light. More than 500 LIHTC apartment units have been built in the past five years in Douglas County. Next year, nearly 400 more are set to be built. Of the 3,956 housing units permitted in 2017, the county reports that apartment units made up 34% of the total new permits. For LIHTC apartments, interest lists typically fill up within days, housing partnership leaders say.

Tackling Transportation Woes

Skeins of roadways are ubiquitous in Douglas County, and residents say traffic is a concern.

Traffic and long commutes also put a strain on daily life in Douglas County, where 78% of the workforce drive alone to work, according to the latest County Health Rankings. In the Exurbs, the median is 83%.

Among the workers commuting alone in Douglas, 42% drive more than 30 minutes to work. In the Exurbs nationally, a median of 45% drive this long to work. The top U.S. performers post a rate of 15%, the Rankings show.

It’s not surprising, then, that just 27% of Douglas County voters agreed with the statement that “traffic across the county seems to be improving,” according to the 2017 survey. At the same time, 66% were satisfied with “traffic management”; in the 2014 survey, the satisfied figure reached 84%.

The picture is muddier when drilling down to consider other forms of transportation. While 54% of voters said “the transportation system is safe and effective,” 46% want to spend more money for a “safe, affordable & accessible transportation system for residents and visitors,” according to the 2017 survey.

As residents seek more travel options, the county is working on a 2040 Transportation Master Plan that it says “will define a long-range vision for a multi-modal transportation system,” including “roads, bridges, highways, public transit, as well as walking and biking options.”

Some community leaders are hearing about gaps in transportation. Some in Douglas County say the fixed bus route system is not meeting their needs, says Doug Tisdale, chairman of the board of directors at Regional Transportation District (RTD), which includes eight counties and provides light rail, fixed bus routes and commuter rail that’s similar to Amtrak.

Where there are gaps, RTD is trying to fill them: a call and ride system helps people move from where they are to a light rail stop or another point; access a ride helps travelers who have mobility issues or cognitive challenges. Separately, Douglas County partners with Lyft and faith-based organizations to help older adults, people with disabilities, low-income families and others get where they need to go through a volunteer-run operation.

In Douglas County, RTD’s southeast rail line will expand to three more stations in Lone Tree by early 2019, Tisdale says. The southwest line includes a planned extension into Highlands Ranch, but funding is an obstacle.

Through the building process, culture and assumptions surrounding mass transit remain, Tisdale says. He points to Douglas County’s independent streak, including Castle Rock’s past decision to opt out of the regional district. Others believe that a train or bus stop should be near them wherever they are or that a train line will eventually be extended. Misconceptions about transit users are hard to shake, he adds. In Tisdale’s experience, riders are workers, students, and families heading downtown or to the airport.

In the end, the place’s history perhaps maintains the strongest hold on the people here. “The model of Colorado was always one man, one horse,” says Tisdale. “Even though the vast majority of people who live here now are not Colorado natives, there’s some of that old Colorado sensibility that somehow is embodied in them, and it’s still one man, one horse…. They had stagecoaches, too, and those were pretty efficient…. We are sort of a modern stagecoach.”

Index: Characteristics of 10 Community Types

by Elizabeth Sherwood, Ari Pinkus and Dante Chinni October 03, 2018 Print

Listed here are the main Health Report findings for the 10 ACP community types the Project didn’t visit for this report. On the bottom of the page is a link to download the health data by community type.

Aging Farmlands: The 161 counties in this group are set on the Great Plains. They are small and rural communities, with only about 3,500 people per county and 92% occupying rural land, according to the U.S. Census. These counties are the oldest on average in the ACP, with more than 23% over the age of 65, and the least diverse racially and ethnically. The Farmlands are 92% white and about 4% Hispanic. These areas experience low rates of higher education. Only 19.6% have a college degree, compared to the national average of about 30%. Though these areas are not prone to excessive drinking, the percentage of driving deaths involving alcohol is 33%, 14% higher than the national average. Access to healthcare is difficult in these communities: The ratio of population to primary care physicians outpaces the national average by more than 1,000:1.

College Towns: These 154 counties are scattered around the country and are generally located near large colleges and universities. Filled with college students, about 8% of the population sits between the ages of 18 and 21 — far higher than any other type. They are also less diverse than the nation as a whole, about 80% white, 7% black and 7% Hispanic. These counties hold a large number of college graduates; 36% have at least a bachelor’s degree, more than any other community type. Despite high levels of education, average median household income in College Towns sits slightly below the national average at $52,100. Access to healthcare in these communities is greater than in other places, with nearly 200 fewer people per primary care physician than the national average. Similarly, the average ratio of population to mental health providers is 359:1, compared to the national average of 470:1. Despite a large population of young adults, excessive drinking only exceeds the national average by 2%.

Evangelical Hubs: Evangelical Hubs are concentrated heavily in the South, forming a belt that spans from Texas to North Carolina. The key distinguishing characteristic for these 372 counties is the high number of religious adherents tied to evangelical churches like the Southern Baptist Convention. Beyond religious ties, a few additional factors drive community culture here: They are less diverse (82% white), and have lower incomes (a median of about $42,700) and lower education levels (about 16% have a bachelor’s degree or more). Access to healthcare in these communities is low, with nearly twice the population per primary care physician and mental health provider than the national averages. Evangelical Hubs are also a leader in teen pregnancy, with a rate of 46 births per 1,000 females ages 15 to 19, nearly twice the national average.

Graying America: Fairly rural and scattered around the country, these 364 counties are full of retirees and those nearing retirement age. Graying America is middle-income, about $47,800 annually for the median household. But, of course, a big defining factor is age. Almost a quarter of everyone in these counties, 24%, are 62 years of age or older; only 19% are under 18. Nearly 80% are white. Healthcare is harder to come by in these areas, with an additional 393 people per primary care physician than the national average. Additionally, injury deaths are particularly high, 94 compared to the national average of 65 deaths due to injury per 100,000 people. Despite a high percentage of the population meeting retirement age, unemployment hovers slightly above the national average by about 1%. The people here also have fewer opportunities to exercise, with 72% having adequate access to exercise facilities compared to the national average of 83%.

LDS Enclaves: Based around Utah and the Mountain West, these 41 counties are the centers of the nation’s Mormon population. The Enclaves are one of the least diverse types, with a population that is 87% white and .5% African American — 9% of the population identifies as Hispanic. The LDS Enclaves are one of the youngest types in the ACP, with 29% of the population under the age of 18. They are middle-income with an average median of $55,600 annually. The people here are fairly well educated, with just over 30% holding at least a bachelor’s degree. Likely due to the large LDS population, there is less excessive drinking in these communities, 4% below the national average. Safety is evident in these communities as well. Reported violent crimes per 100,000 people averages only one-third of the national average.

Military Posts: Marked by the presence of troops and bases, these 89 counties are located largely in rural locales. Their military ties make them relatively young, with only 13% of the population 62 years of age or older. And they feature a larger African American population than average, 16%. The median income in Military Posts sits just above the national average at $57,700. More than a quarter of the people in these communities have a college degree. Health behaviors are not positively emphasized here. These communities report 6% more alcohol impaired driving deaths per 100,000 population than the national average. Adult obesity sits 4% above the national average and physical inactivity hovers just above the national average as well.

Native American Lands: Dotted primarily across the west, these 43 counties are marked by large Native American populations — more than half the people who live in these counties overall are indigenous Americans. College education rates and income are low in these counties. On average, only 14% have a college degree, and the median household income is about $41,700. People have limited access to exercise opportunities, with only 41% of the population receiving adequate access to facilities for physical activity. Combined with other factors, lack of exercise contributes to a high adult obesity rate at 8% above the national average. Likely due to poor health behaviors, nearly one quarter of the population reports fair or poor health, well above the national average of 16%.

Rural Middle America: This collection of 599 counties runs across the northern half of the country, starting up in Maine through the Great Lakes and across to Montana and Washington state. These counties have a less diverse population (91% white) that is spread into less urban locales — 62% of the population lives in places the Census labels as rural. Though they tend to be made up of small towns, these places generally do not rely heavily on agriculture. Wealth in Rural Middle America sits just below the national average, with an average median income of $52,600. Access to healthy food in these communities is favorable, with a Food Environment Index of 8.04, above the national average of 7.7. Although this food is available, these communities still experience a high rate of adult obesity, 32% compared to 28% nationally. This could be due to lack of access to exercise opportunities, which only 65% of adults in these communities have. Despite these issues, healthcare seems accessible here, with only 9% of the population uninsured, 2% lower than the national rate.

Urban Suburbs: These 106 counties hold the wealthy, diverse suburbs of most major cities, and they have come to take on many of those big city characteristics. They are densely populated — the average Urban Suburb is home to roughly 500,000 people — and diverse. The population of these counties is about 58% non-Hispanic white, 11% African American and 16% Hispanic. They are the wealthiest and best educated of all the types in the ACP — average median household income is about $68,000, and 37.2% of adults have a bachelor’s degree. As they grow more dense and urban, poverty rates are increasing. Currently, 15% of children live in poverty and 46% are eligible for reduced price school lunch. People here enjoy more opportunities for physical activities, with 9% more individuals reporting access to exercise facilities than the national average. Healthy foods are also more prevalent, with a Food Environment Index — an index of factors contributing to a healthy food environment — of 8.1 compared to the national average of 7.7.

Working Class Country: Working Class Country counties are heavily clustered in specific rural communities in the eastern half of the United States including Appalachia, the Ozarks and the upper-Midwest. Largely rural in nature, Working Class Country counties are among the nation’s least diverse places — 91% white, 2% African American and 4% Hispanic. These counties generally don’t rely on agriculture but rather exist as small service economies with some small manufacturing. Their average median household income of $42,400, sits about $13,000 below the national median. The percent of people with a college degree, 16.4%, is roughly half the national average. Working Class Country counties tend to be older than the nation at large. About 21% of the population are older than age 65. Nationally that figure is 15.6%. Violent crime rates are low as are home costs. People report more frequent poor mental health days here, 4.3 of the past 30 days compared to the national average of 3.7. Despite elevated needs for care, there are about 1,200 additional people per mental health provider here than the national average.

Use this link to download the health data sorted by ACP Community Type:  2018 CHR Data For ACP By Typology 040218 CLEAN

Overview

by Dante Chinni and Ari Pinkus September 19, 2018 Print

The health of Americans varies greatly depending on the kind of community they call home, and different types of communities have knowledge they can share to improve citizens’ well-being. Those findings are at the heart of months of research and reporting from the American Communities Project (ACP) at The George Washington University.

The ACP, working with data from the 2018 County Health Rankings and with the support of the Robert Wood Johnson Foundation, examined thousands of data points through the prism of the ACP’s 15 community types — distinguishable by demographic variables such as income, occupation, race and religion — to find common worries and shareable solutions.

Three dominant themes emerged in the analysis.

  1. Communities with large populations of people of color fare poorly on a variety of important health and community measures. The data suggest the scores are less about specific populations in these communities than they are about the economic and cultural divides running through them.
  2. Mental health concerns cross all community types. The ACP’s community types hold very different geographies, people and economies, but the median county in every type has between 10% and 16% of its population reporting 14-or-more poor mental health days per month.
  3. Some commonly held understandings of many communities and the challenges they face are incorrect. For instance, raising children in a single-parent home is not just an urban worry. And the nation’s most racially and ethnically diverse communities, the big cities, are also its most segregated.

The data make clear that all kinds of communities — from well-educated urban enclaves to rural blue-collar boroughs — face health challenges. Furthermore, the data show what those specific concerns are.

The ACP also visited five communities, each representing one of its 15 types, to find best practices to address citizen health. Interviews with community leaders and officials in Dallas County, Texas; Douglas County, Colorado; Hood River County, Oregon; Jones County, Georgia; and Lake County, Ohio, led to insights into how those communities deal with their respective challenges and revealed programs and ideas that others can put into practice.

Combined, the ACP’s research and community investigations encompass a deep examination of the socioeconomic, cultural and health-related ties that bind together the United States’ complicated patchwork of communities in 2018 and an exploration of what these communities can learn from one another.

The Tapestry of American Communities

Your community is more than your home; it defines your life, from job opportunities and consumer choices, to the quality of education, to air quality and exercise options. And just a few miles can make a dramatic difference. Consider three Michigan counties that abut one another — Oakland, Macomb and Wayne.

In the 2018 County Health Rankings & Roadmaps— a partnership of the Robert Wood Johnson Foundation (RWJF) and the University of Wisconsin Population Health Institute — those three neighboring counties are, in essence, different worlds. In wealthy Oakland, 12% of the population report being in only fair or poor health. In Macomb, the number is 15%. In Wayne, it is 19%. Macomb has a significantly higher median household income than Wayne, but it also has a higher rate of drug overdose deaths. And Wayne is the most racially and ethnically diverse, but the economic development and history of the area has also left it more segregated.

The amount of variation in such a small geographic area is noteworthy, but not exceptional. Those communities are not just different places; based on the ACP community types, they are different kinds of places. Oakland, an educated, well-to-do county to the northwest of Detroit, is a quintessential Urban Suburb. Macomb, just east of Oakland, is a blue-collar Middle Suburb. Wayne, just south of both, includes Detroit and, thus, holds the density and diversity of a Big City.

When you look at the nation as a whole, the complexity of community types grows. The ACP’s map of the United States defines 15 community types among the nation’s 3,100 counties. These 15 types were created using dozens of demographic variables and are designed to explore likenesses and differences that exist among communities at the county level. The ACP’s 15 county types are mapped below.

Defining the ACP Types (Click type names to see more  on each.)

African American South: Places with large African American populations. Lower incomes and higher unemployment. Exurbs: Wealthy communities usually on the edge of metro areas, Largely white with lower crime rates. Military Posts: Located around military installations. Younger, middle-income, diverse communities.
Aging Farmlands: Sparsely populated and overwhelmingly white. Low unemployment, agricultural economy. Graying America: Places with large senior communities. Generally rural and less diverse, middle-income. Native American Lands: Places with large Native American populations. Young communities with lower incomes.
Big Cities: Counties holding the nation’s largest cities. Dense and diverse. Hispanic Centers: Large Hispanic populations in mostly rural communities. Younger with lower incomes. Rural Middle America: Largely rural and white communities. Middle income and average educational attainment.
College Towns: Urban and rural communities that are home to campuses and college students. LDS Enclaves: Places dominated by Latter-day Saints adherents. Younger and middle-income. Urban Suburbs: Educated and densely populated communities around major metros. Racially and economically diverse.
Evangelical Hubs: Places with above-average numbers for evangelical adherents. Largely Southern with fewer college grads. Middle Suburbs: Middle-income, blue-collar communities mostly around metro areas. Working Class Country: Rural, blue-collar communities. Low incomes and college graduation rates.

The ACP’s focus on types of community pairs neatly with RWJF’s County Health Rankings. Undergirding the Rankings is the idea that health is about a lot more than what happens in the doctor’s office. Ultimately people’s health is influenced by a complex mix of factors including family life, environmental inputs and economic circumstances — elements deeply tied to our communities. By merging the ACP and the Rankings we can look at how those small differences at the community level fit into broader, hidden national trends.

What the Numbers Say

On behalf of the ACP, the University of Wisconsin Population Health Institute used data compiled by the County Health Rankings & Roadmaps programs to determine variation within and across ACP county types. It also calculated a composite measure of length and quality of life for counties, which was then used to sort counties within each typology. The top-performing counties within each typology were further classified by their within-state rank on health outcomes and health factors.

Do the combined Rankings and ACP data suggest one type of community is the country’s healthiest? Not really. There were limitations. The ACP’s types are not evenly spread across the country. Utah, for instance, is dominated by LDS Enclave communities, meaning those places are spread across all four quartiles in that state. And many states have no Big Cities.

That said, there are some broad trends in the numbers. The semi-urban counties known as Exurbs are the most likely to score in the top quartile of their states’ healthiest places. Nearly 73% of those 222 counties placed in their state’s top quartile. The Urban Suburbs were next, with 57% of those 100 counties scoring in their state’s top quartile. The Big City counties and the College Towns, counties defined by academic institutions in them, followed with about 46% scoring in the top quartile.

Certain county types score lower in the rankings. The counties of the African American South and the places known as Hispanic Centers are much less likely to be in their state’s top quartile — about 6% and 13% respectively. The counties of the Native American Lands scored lowest in the rankings; none were in their state’s top quartile.

And a large number of community types reside in the middle of the Rankings. Military Posts, Rural Middle America, Middle Suburbs and LDS Enclaves, all have roughly 25% to 40% of their counties in the top quartile of their state’s health rankings.

But that surface look at the data misses the real story in the numbers and the people and place behind them. For important reasons, this report is not about finding the best type of place to live.

First, much can depend on the place you actually live and the measure you care most about. There is a lot of variation in the numbers even within types.

The chart below is interactive. You can choose the indicator you want to explore, from uninsured rates to premature death, by scrolling through the  options in the box in the top left. The black line within each type represents its median value. You can also search for any county in the country by entering its name in the “Find a County” box.  The chart shows not only the differences in the community type medians but also how communities are clustered in some types and spread across the line in others.

And, beyond those numbers, consider this: With all the different types of communities in the United States — from sparse rural areas to dense cities — the overwhelming majority of Americans are quite content with their community. In 2017, Gallup asked Americans to rank the statement “The city or area you live is perfect for you” on a scale of 1 (lowest) to 5 (highest). More than 60% of Americans gave the statement a 4 or 5. And that finding was remarkably consistent across the ACP types.

This report does not identify “winners.” Rather, it aims to find what we can learn from each community type about improving health and well-being, so people can make their communities healthier no matter where they live.

What can the Exurbs teach us about growing healthy communities and what can they teach each other? What are the shared drivers behind the challenges faced by the counties in the African American South? Are there lessons in the counties of Graying America for the rapidly aging Middle Suburbs?

Three Trends in the Data

Digging into the numbers, there are marked differences across many measures, including the three key findings in the analysis.

Communities with large populations of people of color fare poorly on a variety of important health and economic measures. This seems to be less about the specific populations in these communities than it is about the socioeconomic and cultural divides running through them. Those pressures create special challenges for these communities. The challenges are visible in data on the African American South, Hispanic Centers and Native American Lands.

The median county in those three types stands apart on a range of important factors and outcomes. They sit above the other county types on the percentage of people reporting they are in poor or fair health and the percentage of uninsured adults, but also on broader socioeconomic measures, including the percentage of disconnected youth and the percentage of children eligible for free or reduced school lunch. That combination of scores suggests that limited economic and educational opportunities are at the root of the obstacles these communities face.

In a sense, these data speak to the long-term challenges these communities face and how interconnected those challenges are — for all age groups. Children in these places start off behind their peers in other community types and are more likely to need aid in school. Later, as adults, they are less likely to have health insurance and, ultimately, less likely to be healthy. Again, these splits aren’t just about the lower incomes in these communities, but about deeper community rifts. (We explore these rifts further in the community narratives of this report.)

Mental health concerns cross all community types. The ACP’s community types look very different in their geographies, people and economies, but the median county in every type has between 10% and 16% of its population reporting 14-or-more poor mental health days per month.

Those numbers are particularly arresting when you take into account the Centers for Disease Control 2018 report that death by suicide climbed by 25% between 1999 and 2016. And while the figures are higher in some places than others, they seem to defy simple explanation. The well-to-do, semi-urban Exurbs and Urban Suburbs, at 11%, look the same as middle-income Rural Middle America. The number for the youthful College Towns, 12%, is the same as the number for the aging Graying America counties.

Furthermore, we found mental health concerns to be a top priority in every county we visited — though the driving factors were not necessarily the same. The one true outlier in the data is the Native American Lands.

The data also reveal how we may misunderstand different kind of communities. Some findings in the County Health Rankings are somewhat counterintuitive.

For instance, while urban areas are often viewed as the core of the nation’s struggle with single-parent homes, the figures are actually spread across the country to many different kinds of communities. About 38% of the children in the median Big City county, as well as 36% in the Middle Suburbs, live in single-parent homes.

Looking at diversity, we also found noteworthy revelations. Big City communities are among the most diverse in the country — the median Big City is only about 47% white. But those same communities also score higher on segregation than other kinds of communities, even those with fairly multicultural populations such as the Urban Suburbs, African American South and Hispanic Centers. That is to say, even if you live in a place that looks like a melting pot from 30,000 feet, on the ground it may look much more monochromatic.

The numbers show that the much-publicized racial and ethnic diversification of the nation has a hard time breaking through the racial and ethnic boundaries that define many communities — even in places that look diverse in high-level data. Those boundaries often have deep historical roots that were created by generations of migration patterns — conscious and unconscious decisions by racial and ethnic groups that essentially remain in effect today, particularly in Big Cities.

And rural living doesn’t necessarily mean long, solitary drives. In fact, the county type known as the Aging Farmlands is among the least likely to have long commutes driving alone. In the median Aging Farmlands county, only 22% of the people who drive to work alone have a commute time of more than 30 minutes. The figure is 27% in the median Rural Middle America county, 39% in the dense, prosperous Urban Suburbs and 45% in the Exurbs. In other words, small town/rural communities seem to offer drivers an advantage over more densely populated areas.

Next Steps

There are other large patterns in the data, which can be explored in the index of this report. Short analyses of all the ACP community types as well as an excel sheet with data can be downloaded by individuals and communities. We believe these community trends and data sets are crucial to communities and community leaders. First, they allow community leaders to see how their home compares to similar places — and whether their community is an outlier in certain statistical areas. Second, the trend data should give communities other places to turn to for models and approaches to community health and engagement.

To see what these data look like on the ground, we visited five specific communities and talked to local leaders about how they are handling the concerns they face every day. How do they strive to make their communities better? What challenges do they face? What successes have they had? You can read descriptions and solution highlights below, and dive deeper into the communities by clicking the links.

Dallas County, Texas: The Big City

Scattered around the country, the Big Cities stand out for their diversity. These counties are a true mosaic socioeconomically, racially and ethnically (48% white, non-Hispanic, 16% African American, 11% Hispanic and 6% Asian). They are also the most segregated communities in the country.

  • Collaborations among nearly 100 community nonprofits, including the North Texas Food Bank, large shelters and faith-based institutions, share information about patients to better coordinate care and understand the social and economic factors that shape health.
  • An initiative started by Children’s Health in Dallas integrates mental health care within children’s primary care — with encouraging results.
  • Paul Quinn College, a historically black college in southern Dallas, has adopted the work-college model, reducing its graduates’ student-loan debt. The college has also turned its football field into a farm, helping alleviate food insecurity in a food desert.

Douglas County, Colorado: The Exurb

Exurbs, which tend to sit on the edge of major metropolitan areas, are generally wealthy (median household income of more than $65,000), well educated (34% with a bachelor’s degree) and not especially diverse (81% white, non-Hispanic). They are also known for long, solo commutes by car; 83% of workers drive alone to work. In short, they are communities where the old suburban ideal still reigns.

  • Through the Douglas County Mental Health Initiative, 40 community partners help connect people with mental health services they need. Since May 2017, the county has created two Community Response Teams, each composed of fire/EMS, law enforcement and a clinician — with promising results.
  • To cope with rapid growth, including an increasing senior population, the county is helping seniors, people with disabilities, low-income residents and others get from one point to another through a partnership with Lyft and faith-based organizations.
  • The Regional Transit District is extending light rail lines in the county.

Hood River County, Oregon: The Hispanic Center

Heavily rural and based primarily in the nation’s Southwest with pockets in the Northwest, Hispanic Centers face significant socioeconomic and health challenges. Only about 17% of these individuals hold a bachelor’s degree and the average median household income sits low at $45,800. These communities have limited access to care. About 19% are uninsured, nearly twice the national average.

  • Community health workers have long facilitated residents’ connections with healthcare and social service providers. The successful model is now helping Latinos launch businesses.
  • As state-issued IDs have become harder for immigrants and others to obtain, a community ID card, approved in June, is expected to allow county residents to connect with civic, public safety and other community services.
  • Built in 2011, Hood River Crossing contains 40 one-, two- and three-bedroom units, and more affordable housing is in the works to address access to safe and affordable housing.

Jones County, Georgia: The African American South 

 Based heavily in the Southeast states, the counties of the African American South struggled on the whole in the County Health Rankings, having the second-highest premature death rate among all types (more than 10,000 years lost per 100,000 population). Obesity rates (35%) and smoking rates (21%) also tend to be higher.

  • The initiative Live Healthy Jones aims for residents to better attend to their health, including choices about diet and exercise.
  • To provide for residents without health insurance, Community Health Care Systems opened in Jones County about five years ago.
  •  A group of white and African American pastors meets regularly and discusses touchy issues, including politics and racial profiling. African American and white churches worship together over holidays.

Lake County, Ohio: The Middle Suburb 

Primarily nestled in the aging, inner-ring suburban areas of the Industrial Midwest, Middle Suburbs contain a unique mix advantages and challenges. They hold the lowest percentage of uninsured people (7%), but they score highest for drug-overdose deaths (26 per 100,000 people).

  • Lake County General Health District generated an idea that uses Geographical Information Systems to tackle the opioid crisis.
  • The Better Flip is an initiative by the Lake County Ohio Port & Economic Development Authority to make post-World War II homes on the west end of the county more attractive to young potential homeowners.
  • Leadership Lake County started a program two years ago to help millennials see their place in the county. The organization encourages other groups in the county to diversify their boards, including appointing two millennials at a time because the buddy system works.

More to Come

In a country as big and diverse as the United States, we need a new way to understand geography. Sometimes a community has more in common with a place hundreds of miles away than it does with the city or county next door. This report begins to explore this idea. There will be more deep dives in subsequent work, including one into the complexities of rural America.